


 Best Gold Stocks to Buy Now: AABB, GOLD, GDX
  FxWirePro: Daily Commodity Tracker - 21st March, 2022


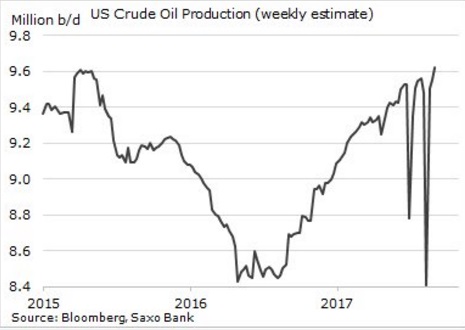
Here are some key charts based on data from United States’ Energy Information Agency (EIA) that explains the level of inventories, refinery demand, and production.
- Chart 1 shows crude oil production in the United States which has reached a new record high of 9.62 million barrels per day.
- Chart 2 has been making the refiners around the world cheer and filling OPEC with joy as it shows that distillate inventories have declined significantly and fallen below 5-year average. It is at 125.53 million barrel, down more than 53 million barrels since the beginning of the year and down 3.359 million barrels from the previous week.
- U.S. oil imports have been declining over the past couple of year. Chart 3 shows that imports have fallen well below 5-year average thanks to the hurricane season and devastating effects of Harvey, Irma, and Nate. It is showing signs of a rebound. However, last week, imports declined for a second consecutive week to 7.377 million barrels per day, down from 7.571 million barrels in the previous week.
- Chart 4 shows the level of U.S. crude oil exports, which has declined sharply last week to 0.869 million barrels per day from a record high of 2.113 million barrels per day in the previous week.
- Chart 5 shows U.S. refinery demand, which suffered a major blow during Hurricane Harvey and the like of Hurricane Nate is stabilizing. Yesterday’s report shows it at 16.305 million barrels per day.
- Chart 6 shows the level of crude oil inventories, which has declined around 78 million barrels since March to 457.1 million barrels.
FxWirePro launches Absolute Return Managed Program. For more details, visit http://www.fxwirepro.com/invest


