


 China's Refining Industry Faces Major Shakeup Amid Challenges
  Moldova Criticizes Russia Amid Transdniestria Energy Crisis
  FxWirePro: GBP/NZD gaining momentum for a move towards 2.3100 level
  Global Markets React to Strong U.S. Jobs Data and Rising Yields
  UBS Projects Mixed Market Outlook for 2025 Amid Trump Policy Uncertainty
  European Stocks Rally on Chinese Growth and Mining Merger Speculation
  Indonesia Surprises Markets with Interest Rate Cut Amid Currency Pressure
  Mexico's Undervalued Equity Market Offers Long-Term Investment Potential
  FxWirePro: GBP/AUD sustains gains as uptrend remains strong
  U.S. Banks Report Strong Q4 Profits Amid Investment Banking Surge
  NZDJPY Bears Reload as 92 Resistance Caps Bounce; Sell-on-Rallies Eyed Toward 90
  2025 Market Outlook: Key January Events to Watch
  Stock Futures Dip as Investors Await Key Payrolls Data
  FxWirePro- Woodies pivot (Major)
  Sterling Slump Sends GBPJPY Toward 212.60 — Bearish EMA Stack Eyes 210
  NZDJPY: The Kiwi Yen's Bull Run Hits a Brick Wall at 92 — Sell the Rally?
  FxWirePro: USD/ZAR remains buoyant, looks to extend gains


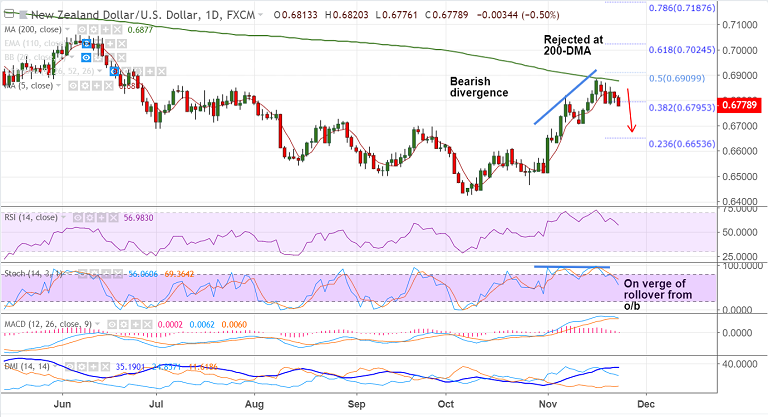
NZD/USD chart on Trading View used for analysis
- NZD/USD slumps lower on broad-based kiwi weakness. Oil weakness weighing on the antipodeans.
- The major is trading 0.49% lower on the day at 0.6779 at the time of writing.
- Price action was rejected at 200-DMA and any bullish continuation only on break above.
- The pair is on track to test 110-EMA at 0.6716. Break below to see further weakness.
- New Zealand quarterly Retail Sales data due for release early Monday session will be in focus for further impetus.
Support levels - 0.6716 (110-EMA), 0.67, 0.6676 (55-EMA)
Resistance levels - 0.6810 (5-DMA), 0.6877 (200-DMA), 0.69
For details on FxWirePro's Currency Strength Index, visit http://www.fxwirepro.com/currencyindex.


