Technicals

Add as a preferred source on Google

FxWirePro: NZD/USD holds 21-EMA support, break below to see more weakness

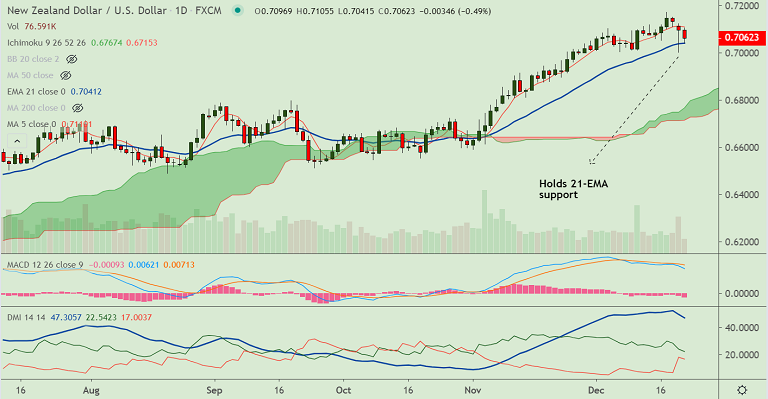
NZD/USD chart - Trading View - NZD/USD edges higher from session lows at 0.7041, finds strong support at 21-EMA - Price action has slipped below 200H MA and intraday techs support weakness - Analysis of GMMA indicator sh…

1 min read
FxWirePro: NZD/USD holds 21-EMA support, break below to see more weakness
Image from the original EconoTimes article

Read the original article

NZD/USD chart - Trading View 

- NZD/USD edges higher from session lows at 0.7041, finds strong support at 21-EMA

- Price action has slipped below 200H MA and intraday techs support weakness

- Analysis of GMMA indicator shows major trend is bullish, but minor trend is turning bearish

- RSI and Stochs are on verge of rollover from overbought levels

- Bearish divergence on RSI and Stochastics on the daily charts keeps scope for downside

- Price action is above cloud, but Chikou span is biased lower 

Support levels - 0.7042 (21-EMA), 0.7112 (5-DMA), 0.7145 (Upper BB)

Resistance levels - 0.7095 (200H MA), 0.6981 (Lower BB), 0.6903 (55-EMA)

Summary: NZD/USD is extending weakness for the 3rd straight session. Scope for further downside on decisive break below 21-EMA. 

 

Related articles

View all
Technicals

Major Pair Currency Score: AUDUSD Bearish

EURUSD - Levels to watch - 1.100 GBPUSD Levels to watch - 1.3180 USDCHF Levels to watch - 0.8400 USDCAD - Levels to watch - 1.4300 AUDUSD - Levels to watch - 0.7000 NZDUSD - Levels to watch - 0.5560

