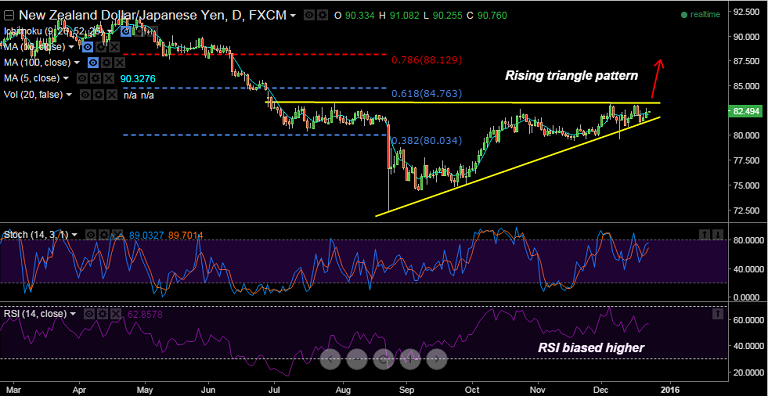
FxWirePro: Rising triangle pattern found on NZD/JPY charts, strong resistance at 83.20
Rising triangle pattern found on NZD/JPY charts, with strong resistance at 83.20 trendline. Price action is above the cloud and Tenkan and Kijun show bullish crossover above the cloud which shows upside potential, RSI po…
Rising triangle pattern found on NZD/JPY charts, with strong resistance at 83.20 trendline.
Price action is above the cloud and Tenkan and Kijun show bullish crossover above the cloud which shows upside potential, RSI points north while Stochs are in nuetral territory.
The kiwi making headway after slightly narrower-than-expected November trade deficit lends support. Broadly stable commodity prices and improving risk appetite also helping the Kiwi.
Watchout for breaks above 83.20, pair could then target 84.76 (61.8 % Fib of 92.40-72.40 fall).
NZD/JPY is currently trading at 82.51 with immediate support at 82.06 (5-DMA) and resistance at 82.79 (Dec 22 high)