


 Major Forex Pairs Action Bias: GBPUSD and AUDUSD Turn Extremely Bearish
  FxWirePro: EUR/AUD regains upwards momentum but unable to hold above 50%fib level
  FxWirePro: USD/CAD slips after Fed holds rates steady
  FxWirePro: EUR/ AUD gains some ground , but remains on bearish path
  FxWirePro : GBP/NZD strongly bearish despite upside attempts
  FxWirePro: GBP/AUD gains some upside momentum but still bearish
  FxWirePro: USD/ZAR firms ahead of Fed interest rate decision
  FxWirePro: GBP/AUD gains above 1.9200 level , upside pressure builds
  FxWirePro: NZD/USD firms as Kiwi gains on strong ANZ business outlook data
  FxWirePro: GBP/NZD maintains bersish bias with focus on 2.2900 level
  FxWirePro- Major Crypto levels and bias summary
  FxWirePro- Major Pair levels and bias summary
  FxWirePro: NZD/USD neutral in the near-term, scope for downward resumption
  JPY Action Bias: EURJPY and CADJPY Emerge as Extremely Bullish Pairs to Watch
  FxWirePro: AUD/USD dips below lower range, bearish bias increases
  FxWirePro- Woodies pivot (Major)


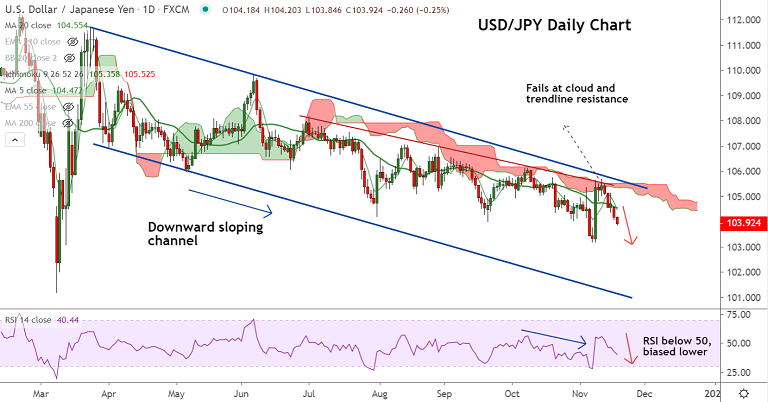
USD/JPY chart - Trading View
Technical Analysis: Bias Strongly Bearish
- USD/JPY extends weakness after rejection at daily cloud, slumps below 104 handle
- MACD shows bearish crossover on signal line, 5-DMA confirms bearish crossover on 20-DMA
- Momentum strongly bearish. Stochs and RSI are biased lower, RSI well below 50 mark
- Volatility is high and rising as evidenced by widening Bollinger bands
- Analysis of GMMA indicator shows major and minor trend are strongly bearish
Support levels - 103.47 (Lower BB), 103.17 (Nov 6th low), 103
Resistance levels - 104.46 (5-DMA), 104.64 (200H MA), 105.11 (55 EMA)
Summary: USD/JPY has dived below the 104 handle. Technical indicators show scope for further weakness. Price action has slipped below the 200-month MA at 103.92, close below for the week will open downside for the pair. Scope for test of 101.65 (Major trendline support).


