


 ETHUSD Surges Past $2700 on Strong Institutional Demand, Technicals Show Bullish Crossover Despite Cooling ETF Inflow Momentum
  Crypto Alpha Command: BTC & ETH derivatives Intelligence
  FxWirePro-24-Hour Crypto Category-Based Performance Dashboard
  Bitcoin Surges Past $85,000 Amidst Rising Risk Appetite


 Add as a preferred source on Google
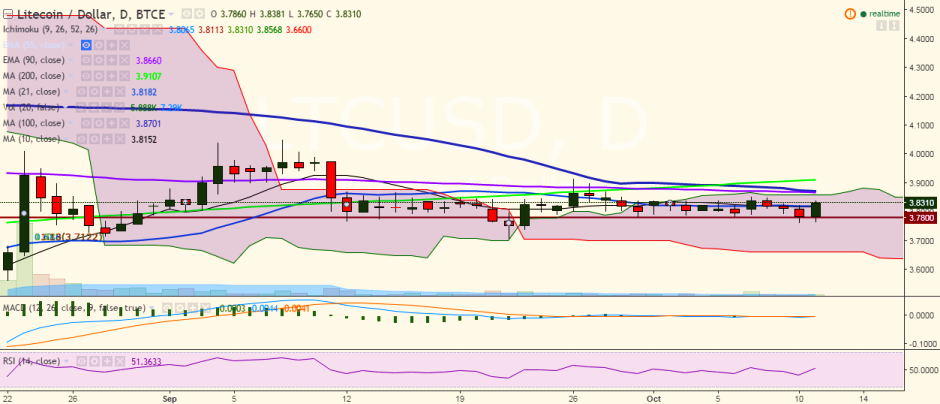
LTC/USD has broken above 21-day MA after hitting a fresh low of 3.76 levels on Monday. It is currently trading at 3.83 levels (BTC-e).
Ichimoku analysis of daily chart:
Tenkan Sen: 3.80
Kijun Sen: 3.81
Trend reversal: 3.86 (90 EMA)
On the upside, a close above 3.81 levels (21-DMA) would target 3.90 levels (200-day MA). Further strength would see the pair testing 4.05 (September 08 high).
On the downside, support is seen at 3.78 levels and a break below would weaken the pair to 3.70 (September 22 low)/3.50 (psychological level).

- News

- Economy

- Central Banks
- Investing
- Research
- Roundups
- Digital Currency
- Insights
- Technical Analysis
- Technology
- Business
- Law
- Health
- Nature
- Fintech
- Science
- Topic
- Opinions
- ©Econometrics LLC . All Rights Reserved.
LTC/USD breaks above 21-DMA, close above targets 3.90
Tuesday, October 11, 2016 11:28 AM UTC
Editor's Picks



- Market Data
Most Popular




