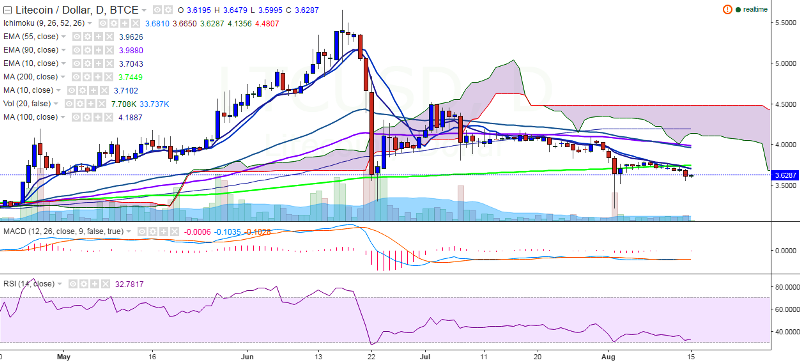
LTC/USD continues to trade weaker and has hit a low of 3.55 yesterday. It currently trades at 3.61 levels at the time of writing (BTC-e). Ichimoku analysis of daily chart: Tenkan Sen: 3.68 Kijun Sen: 3.67 Trend reversal:…
By Shampa Mani
Updated 1 min read
Image from the original EconoTimes article
LTC/USD continues to trade weaker and has hit a low of 3.55 yesterday. It currently trades at 3.61 levels at the time of writing (BTC-e).
Ichimoku analysis of daily chart:
Tenkan Sen: 3.68
Kijun Sen: 3.67
Trend reversal: 3.74 (200-day MA)
The pair is trading well below 200-day MA and the short-term trend appears bearish. On the upside, major resistance is seen at 3.74 (200-day MA) and a break above would target 3.99 (90 EMA)/4.19 (100-day MA).
On the flipside, support is seen at 3.44 (61.8% retracement of 3.22 and 3.80) and any weakness below this level would drag the pair to 3.22 (August 2 low)/3.00.
According to latest estimates from Coinmarketcap.io, Litecoin is the fourth largest cryptocurrency with market cap over $172 million at the time of writing.