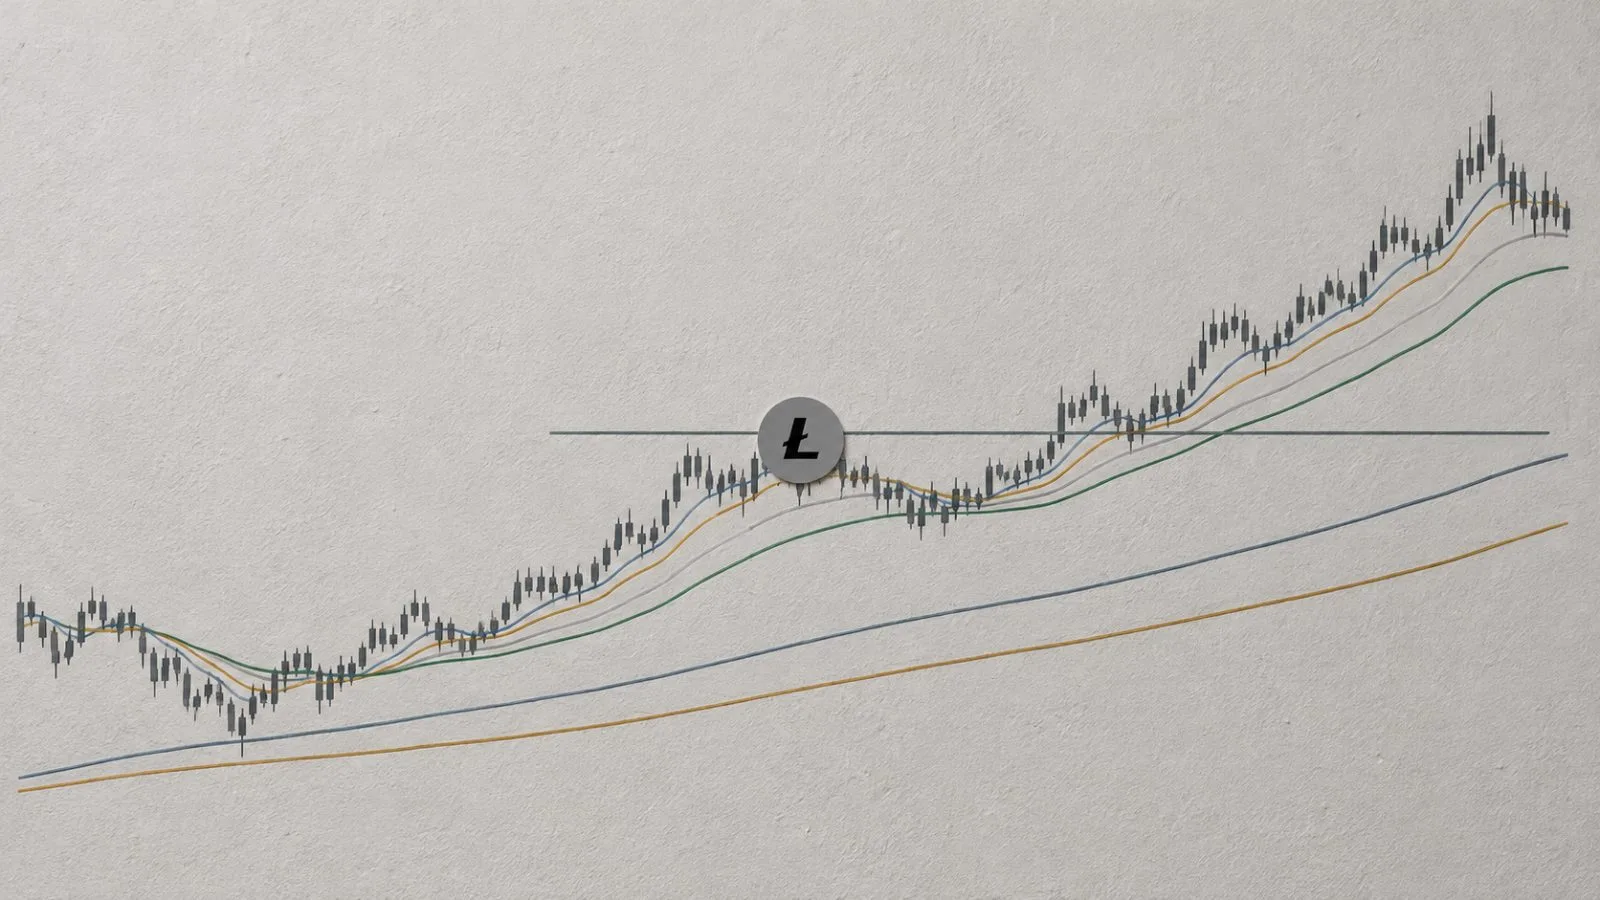
CoinGabbar analyst Dikshant Dibbey maps a November $53.77-$59.24 base range for Litecoin (LTC), with a $47.56 downside scenario.
The outlook places Litecoin’s base band between $53.77 and $59.24. Dibbey’s bear scenario links a daily candle trading below $53.77 to a $47.56 target.
Dibbey’s analysis uses $59.24 as the 50-day exponential moving average (EMA). Dibbey links a daily candle trading above $59.24 to a $65.74-$74.53 upside range.
Dibbey’s reading of the chart is negative while Litecoin remains under the $59.24 EMA.