


 BTC Flat at $89,300 Despite $1.02B ETF Exodus — Buy the Dip Toward $107K?
  Elon Musk’s Empire: SpaceX, Tesla, and xAI Merger Talks Spark Investor Debate


 - EconoTimes)


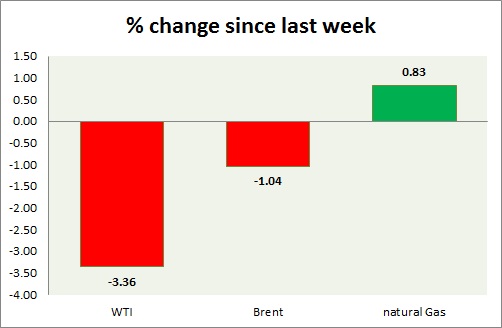
Energy pack is trading in red. Weekly performance at a glance in chart & table.
Oil (WTI) -
- WTI has weakened significantly and more after the release of EIA crude inventory. Today's range $59.1-57.7
- Target for the downside is coming around $50-51/barrel if doji high is not taken out at $62.7. A break above could push prices as high as $70/barrel. $75/barrel remains next target.
- EIA inventory report showed stocks rose by 2.4 million barrels to 465.4 million.
- WTI is currently trading at $57.6/barrel. Immediate support lies at $56-54.6, $51.2-50 and resistance at $63-$65.
Oil (Brent) -
- Brent is relatively better performer than WTI, however tensions over Iran deal is weighing on price. Today's range $62.3-63.5
- Brent-WTI spread gained 70 cents today, currently trading at $4.5/barrel. Spread might rise faster id Iran deal remains eluded beyond 9th July.
- Target is coming around $55/barrel, if doji high is not taken out. A break would push it towards $80/barrel.
- Brent is trading at $62.5/barrel. Immediate support lies at 61.8-61.4 area and resistance at $ 70 region.
Natural Gas -
- Natural gas assaulted and traded above $2.85/mmbtu area, however so far failed to sustain it. Price might target $3.1/mmbtu and $3.5/mmbtu area if support holds at $2.7 and $2.45/mmbtu.
- Natural Gas is currently trading at $2.79/mmbtu. Immediate support lies at $2.7, $2.45 area & resistance at $2.85, $2.93, $3.04, $3.32.
|
WTI |
-3.36% |
|
Brent |
-1.04% |
|
Natural Gas |
+0.83% |


