


 FxWirePro- Major European Indices
  Bitcoin Battles Volatility: Institutional Support Eyes USD 64,000 Floor Amid Geopolitical Tensions
  Euro Ascendant: EUR/USD Breaks $1.17 as Geopolitical Relief Sparks a Bullish Surge
  Bitcoin Breaks the $70,000 Barrier: Bulls Target the $80,000 Horizon as Geopolitical Relief Ignites Crypto Markets
  FxWirePro- Major Crypto levels and bias summary
  Bitcoin Resilience: BTC Reclaims USD 69,000 as Geopolitical Tensions Ease
  FxWirePro- Woodies Pivot(Major)
  NZDJPY Bearish Breakdown: Why Selling the Rallies is the Strategic Play
  FxWirePro: USD/ JPY slips as yen rallies after Mideast ceasefire declaration
  FxWirePro- Woodies Pivot(Major)
  Ethereum Joins the Rally: ETH Reclaims USD 2,100 Following Bitcoin's Lead
  FxWirePro- Major Crypto levels and bias summary
  Ethereum Reclaims Higher Ground: Ether Bulls Target $2,700 as Middle East Tensions Thaw
  Aussie Ascent: AUDJPY Charges Toward 112 as Bullish Momentum Hits Five-Day High


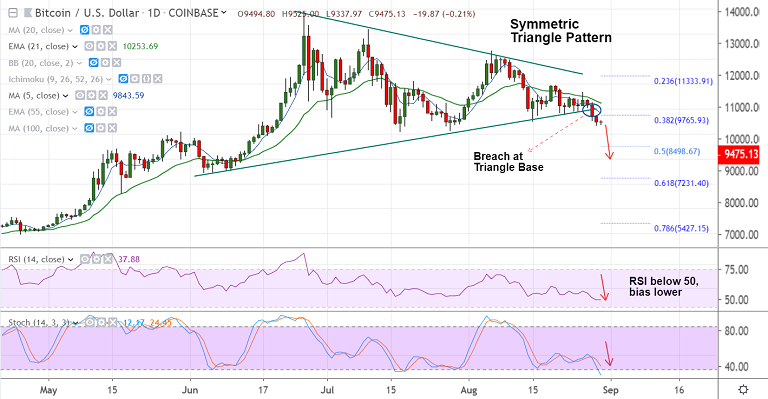
BTC/USD chart - Trading View
Exchange - Coinbase
Support: 8966 (21W EMA); Resistance: 9846 (5-DMA)
Technical Analysis: Bias Bearish
BTC/USD trades in a narrow range, largely muted at 9481 at 05:15 GMT.
The pair has hit 4-week lows at 9321 on Thursday's trade, bias remains bearish.
Technical indicators suggest weakness for the pair. Stochs and RSI are sharply lower.
MACD and ADX support downtrend. 'Symmetric Triangle' breach keeps bearish pressure.
That said, volatility is low on the intraday charts. Oscillators are at oversold levels which could see some pullback.
110-EMA (9522) is immediate resistance. Break above could see test of 5-DMA at 5845. Breakout at 50-DMA required for upside continuation.
Resumption of weakness will see test of 9108 (July 28 low).


