


 FxWirePro: AUD/USD downside pressure builds, key support level in focus
  FxWirePro: USD/JPY firms as Trump's address on Gulf war spark fresh concerns
  FxWirePro- Major Pair levels and bias summary
  FxWirePro: GBP/USD outlook weaker on renewed downside pressure
  FxWirePro- Major Crypto levels and bias summary
  FxWirePro: GBP/NZD range to extend until there is game changing news
  EUR/JPY Bulls Charge: Eyeing 186.00 as Euro Strength Intensifies
  FxWirePro: USD/ZAR sustains gains as uptrend remains strong
  Euro Retreats as Geopolitical Tensions Surge: EURUSD Eyes 1.1400 Floor Amid Safe-Haven Demand
  FxWirePro- Major Crypto levels and bias summary
  Bitcoin Battles Volatility: Institutional Support Eyes USD 64,000 Floor Amid Geopolitical Tensions
  FxWirePro:NZD/USD drifts lower, could be on verge of bigger drop
  Ethereum Rises on Geopolitical De-escalation: Pezeshkian’s Peace Signal Ignites Bullish Momentum
  Bitcoin’s High-Stakes Volatility: BTCUSD Navigates Geopolitical Storms


 - EconoTimes)


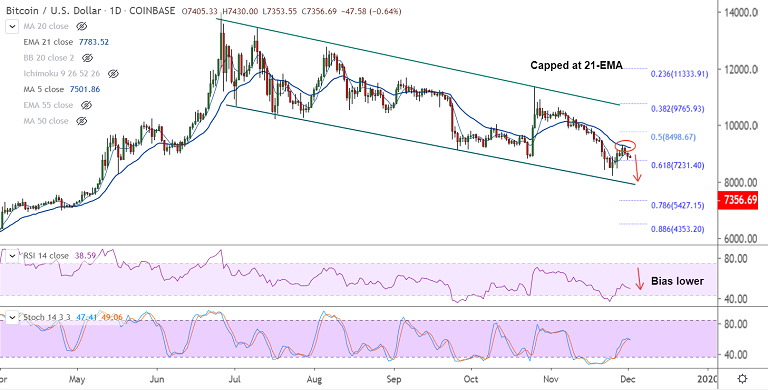
BTC/USD chart - Trading View
Exchange - Coinbase
Support: 7331 (200H MA); Resistance: 7500 (5-DMA)
Technical Analysis: Bias Bearish
BTC/USD was trading 0.68% lower at 7353 at 04:40 GMT, intraday bias is bearish.
The pair is extending weakness for the 3rd consecutive session, scope for further downside.
Recovery attempts in the pair have been capped at 21-EMA, price has slipped below 5-DMA.
Major trend has been bearish and rejection at 21-EMA will likely see downside resumption.
The pair is currently holding support at 200H MA at 7331, break below will see weakness.
Technical studies support downside. MACD failed to make the bullish crossover on signal line.
5-DMA, Stochs and RSI are all biased lower on the daily charts. Stochastics RSI is on verge of rollover from overbought levels.
Break below 200H MA will see dip till 110W EMA at 6889 ahead of channel base at 6100.


