


 FxWirePro: USD/CNY falls to three-year high, scope for further downside
  FxWirePro- Major Crypto levels and bias summary
  Ethereum Reclaims Higher Ground: Ether Bulls Target $2,700 as Middle East Tensions Thaw
  FxWirePro: GBP/AUD downtrend extends, eyes 1.8900 evel
  Bitcoin Breaks the $70,000 Barrier: Bulls Target the $80,000 Horizon as Geopolitical Relief Ignites Crypto Markets
  Ethereum Joins the Rally: ETH Reclaims USD 2,100 Following Bitcoin's Lead
  FxWirePro- Major European Indices
  GBPJPY Surges to 211.88: Sterling Bulls Target 215 Amid Broad-Based Buying
  NZD/JPY Rockets as Kiwi Dollar Resilience Defies the Oil Shock
  FxWirePro: GBP/NZD reverses course, bias back to downside
  FxWirePro- Major Crypto levels and bias summary
  FxWirePro: USD/ JPY slips as yen rallies after Mideast ceasefire declaration
  FxWirePro: EUR/AUD falls below 1.6600 level, plunge to test a key fibo grows


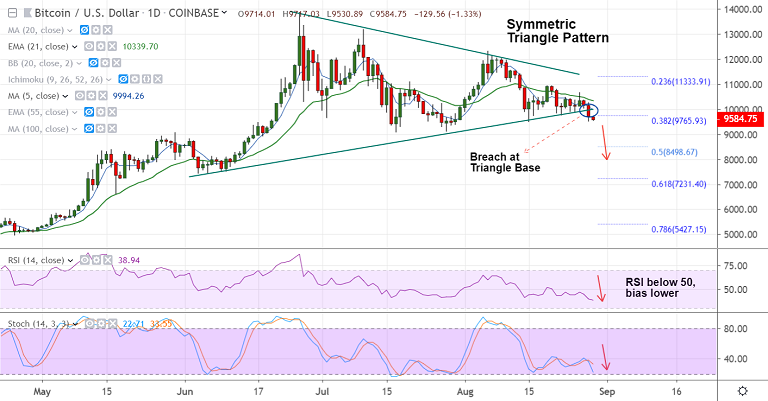
BTC/USD chart - Trading View
Exchange - Coinbase
Support: 9525 (110-EMA); Resistance: 9,999 (5-DMA)
Technical Analysis: Bias Bearish
BTC/USD extends previous session's weakness, trades 1.18% lower on the day at 9589 at 04:20 GMT.
The pair has shown a breach of 'Symmetric Triangle' pattern raising scope for downside.
Price action has slipped below 38.2% Fib. Technical indicators on the intraday charts are biased lower.
110-EMA is strong support (9525), break below eyes next major support at 9108 (28th July low).
5-DMA is immediate resistance at 9999. Breakout above cloud required for bearish invalidation.


