


 FxWirePro- Major Pair levels and bias summary
  FxWirePro: USD/ JPY slips as yen rallies after Mideast ceasefire declaration
  FxWirePro: GBP/USD climbs to 4 -week high as ceasefire deal gives bulls traction
  Bitcoin Resilience: BTC Reclaims USD 69,000 as Geopolitical Tensions Ease
  FxWirePro: GBP/AUD downtrend extends, eyes 1.8900 evel
  FxWirePro: EUR/AUD falls below 1.6600 level, plunge to test a key fibo grows
  FxWirePro: USD/ZAR continues to recovers , upside pressure builds
  FxWirePro: GBP/USD stuck in range but maintains bearish bias
  FxWirePro- Major European Indices
  Bitcoin Battles Volatility: Institutional Support Eyes USD 64,000 Floor Amid Geopolitical Tensions
  Ethereum Retreats Toward USD 2,000: Technicals Signal Caution as ETH Mimics Bitcoin’s Pullback
  FxWirePro- Major European Indices
  Pound Sterling Power: GBP/JPY Secures Third Day of Gains as Global Risk Tensions Recede
  FxWirePro: USD/ZAR slips sharply lower as US-Iran ceasefire lifts risk appetite


BTC/USD chart - Trading View
Exchange - Coinbase
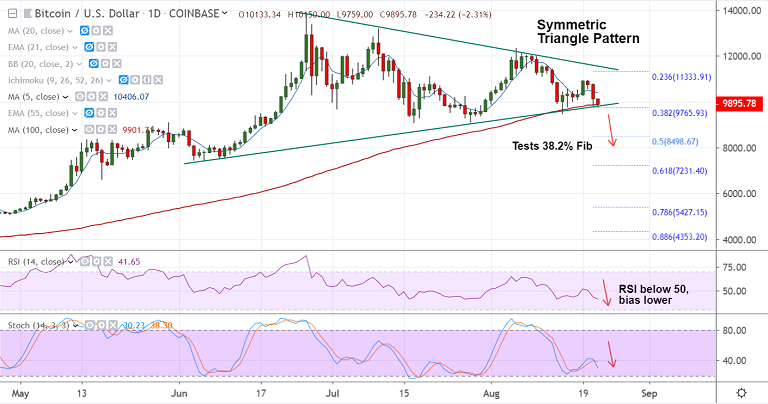
Support: 9446 (110-EMA); Resistance: 10392 (5-DMA)
Technical Analysis: Bias Bearish
BTC/USD edges higher from session lows at 9759, trades 1.98% lower at 9929 at 03:15 GMT.
The pair is extending weakness for the 3rd straight session after upside was rejected at 20-DMA resistance.
Price action briefly dipped below 100-DMA to test 38.2% Fib at 9765, technical studies are bearish.
Stochs are RSI are sharply lower and RSI is well below 50 levels. Intraday volatility is rising.
Price action rages in 'Symmetric Triangle pattern and breach below Triangle base could plummet prices further.
Next major support lies at 110-EMA at 9448. Immediate resistance is at 5-DMA at 10406. Break above 20-DMA required for upside continuation.


