


 FxWirePro: EUR/ NZD downside pressure builds, key support level in focus
  Ethereum Joins the Rally: ETH Reclaims USD 2,100 Following Bitcoin's Lead
  GBPJPY Surges to 211.88: Sterling Bulls Target 215 Amid Broad-Based Buying
  EUR/JPY Breaks Out: Euro Surges Past 185.00 Resistance Amid Strong Bullish Momentum
  FxWirePro:NZD/USD jumps as RBNZ warns of higher OCR potential
  FxWirePro: AUD/USD spikes as Trump announces two-week Iran ceasefire
  Ethereum Braces for Volatility: Technicals Turn Bearish as Geopolitical Tensions Loom
  NZD/JPY Rockets as Kiwi Dollar Resilience Defies the Oil Shock
  FxWirePro: GBP/USD stuck in range but maintains bearish bias
  FxWirePro: USD/ JPY slips as yen rallies after Mideast ceasefire declaration


 - EconoTimes)


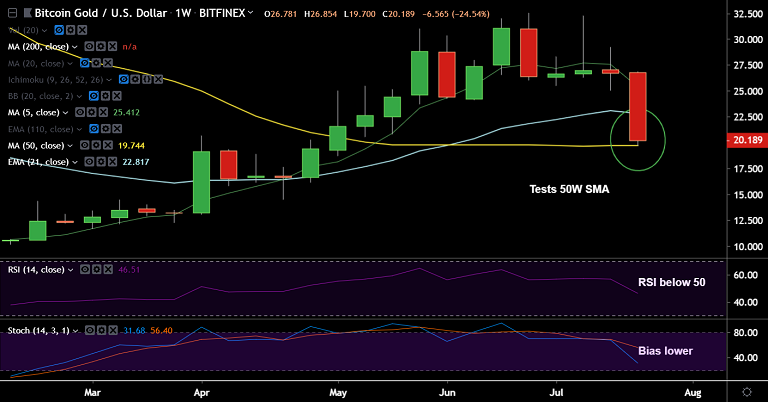
BTG/USD chart - Trading View
Exchange - Bitfinex
Support: 18.48 (200-DMA); Resistance: 23.75 (110-EMA)
Technical Analysis: Bias Bearish
Bitcoin Gold slumps lower, tests 50W SMA at 19.74, bias bearish.
BTG/USD down over 35% in this week till date. Price grinding lower after successive Doji's at highs.
Technical studies paint a bearish picture. Stochs and RSI are sharply lower.
A bearish divergence adds to the downside bias. ADX is rising in support of the downtrend.
Next bear target below 55W SMA lies at 200-DMA at 18.48. Break below 200-DMA required for further weakness.
That said, oscillators have approached oversold territory. Minor pullbacks likely before next leg lower.
5-DMA is immediate resistance at 22.26. Break above could see upside till 110-EMA (23.75)
For details on FxWirePro's Currency Strength Index, visit http://www.fxwirepro.com/currencyindex.


