


 FxWirePro- Major Crypto levels and bias summary
  FxWirePro- Major Crypto levels and bias summary
  NZD/JPY Rockets as Kiwi Dollar Resilience Defies the Oil Shock
  FxWirePro: GBP/NZD reverses course, bias back to downside
  FxWirePro- Major European Indices
  FxWirePro: USD/ZAR continues to recovers , upside pressure builds
  GBPJPY Surges to 211.88: Sterling Bulls Target 215 Amid Broad-Based Buying
  Bitcoin's Tug-of-War: Bulls Eye 80,000 USD Despite Turbulent ETF Outflows
  FxWirePro- Major Pair levels and bias summary
  Ethereum Reclaims Higher Ground: Ether Bulls Target $2,700 as Middle East Tensions Thaw
  FxWirePro- Major Crypto levels and bias summary
  Bitcoin Breaks the $70,000 Barrier: Bulls Target the $80,000 Horizon as Geopolitical Relief Ignites Crypto Markets


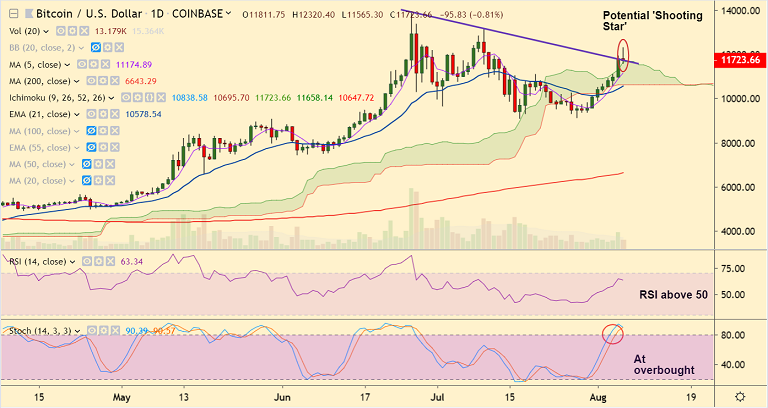
BTC/USD chart - Trading View
Exchange - Coinbase
Support: 11658 (cloud top); Resistance: 12,000 (psychological level)
Technical Analysis: Bias Bullish
BTC/USD extended its bull run in the Asian session, broke above strong trendline resistance to hit 4-week highs above $12,000 mark.
However, the pair struggled to hold gains above 12,000. Price action has slipped from highs at 12320 and is currently at 11684 at 12:35 GMT.
A potential 'Shooting Star' candlestick pattern at highs raises scope for some reversal.
On the hourly charts, the pair has slipped below 21H EMA and eyes strong support at 55H EMA at 11519.
Failure to hold above cloud will see dip till 21-EMA at 10572. Breach at 21-EMA could see further weakness.
On the flipside, close above 12,000 mark will see bullish continuation.


