


 Euro Ascendant: EUR/USD Breaks $1.17 as Geopolitical Relief Sparks a Bullish Surge
  Ethereum Braces for Volatility: Technicals Turn Bearish as Geopolitical Tensions Loom
  Aussie Bulls Charge: AUD/JPY Rallies as Geopolitical Clouds Part
  FxWirePro: GBP/AUD downtrend extends, eyes 1.8900 evel
  Bitcoin's Tug-of-War: Bulls Eye 80,000 USD Despite Turbulent ETF Outflows
  FxWirePro- Major European Indices
  Bitcoin Breaks the $70,000 Barrier: Bulls Target the $80,000 Horizon as Geopolitical Relief Ignites Crypto Markets
  FxWirePro- Major European Indices
  FxWirePro- Major Crypto levels and bias summary
  FxWirePro: USD/ZAR slips sharply lower as US-Iran ceasefire lifts risk appetite
  FxWirePro- Major Crypto levels and bias summary
  FxWirePro: USD/CNY falls to three-year high, scope for further downside


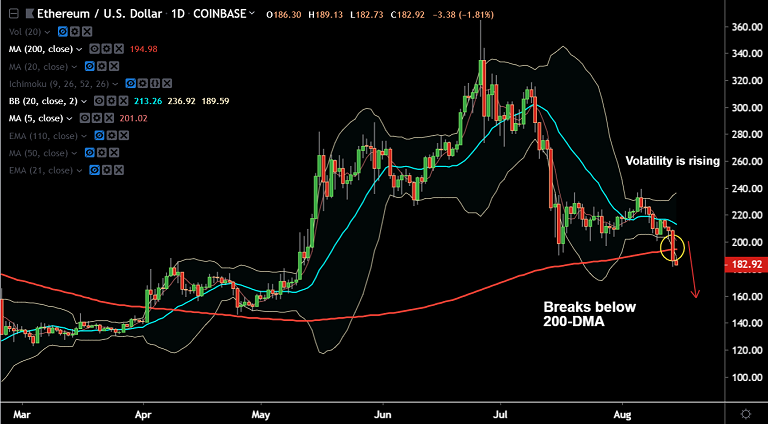
ETH/USD chart - Trading View
Exchange - Coinbase
Support: 168 (trendline); Resistance: 189.05 (61.8% Fib)
Technical Analysis: Bias Bearish
ETH/USD has breached 200-DMA support, opening up further downside.
The pair hit 14-week lows at 178.26, technical bias is strongly bearish.
RSI is well below 50 levels and Stochs show momentum is strongly bearish.
MACD shows a bearish crossover on signal line and volatility is rising as shown by expanding Bollinger bands.
Negative DMI dominance seen and ADX is rising in support of the downtrend.
Price action has slipped below 61.8% Fib and is on track to test trendline support at 168.
200-DMA is now turned resistance at 194.97. Retrace above to extend consolidation.


