


 Ethereum Joins the Rally: ETH Reclaims USD 2,100 Following Bitcoin's Lead
  Bitcoin Battles Volatility: Institutional Support Eyes USD 64,000 Floor Amid Geopolitical Tensions
  FxWirePro- Major Crypto levels and bias summary
  Bitcoin Breaks the $70,000 Barrier: Bulls Target the $80,000 Horizon as Geopolitical Relief Ignites Crypto Markets
  FxWirePro- Major Crypto levels and bias summary
  FxWirePro: EUR/ NZD downside pressure builds, key support level in focus
  Ethereum Reclaims Higher Ground: Ether Bulls Target $2,700 as Middle East Tensions Thaw
  FxWirePro:NZD/USD jumps as RBNZ warns of higher OCR potential
  FxWirePro: GBP/NZD reverses course, bias back to downside
  Ethereum Braces for Volatility: Technicals Turn Bearish as Geopolitical Tensions Loom
  Pound Sterling Power: GBP/JPY Secures Third Day of Gains as Global Risk Tensions Recede


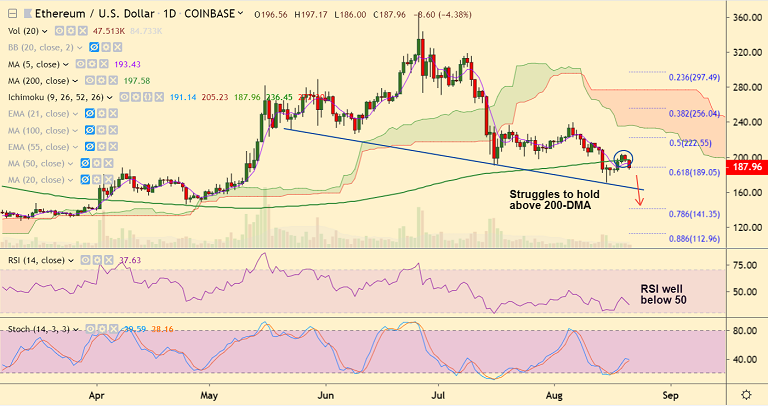
ETH/USD chart - Trading View
Exchange - Coinbase
Support: 171 (Aug 15 low); Resistance: 197.58 (200-DMA)
Technical Analysis: Bias Bearish
ETH/USD extends weakness for the 2nd straight session, bias turning bearish.
The pair has failed to extend gains above $200 mark, slips lower.
Major trend is bearish as shown by GMMA indicator. Parabolic SAR also supports weakness.
Price has slipped below 200-DMA and 200 SMA on the hourly charts. Hovers around 61.8% Fib.
RSI and Stochs are now biased lower. Volatility rising on the intraday charts.
Break below 61.8% Fib (189.05) will see dip till 171 (Aug 15 low) ahead of 165.75 (trendline).
200-DMA is now major resistance at 197.58. Retrace above will see further consolidation.


