


 FxWirePro- Major Pair levels and bias summary
  FxWirePro: AUD/USD downside pressure builds, key support level in focus
  FxWirePro: GBP/NZD remains buoyant, looks to extend gains
  FxWirePro: GBP/NZD range to extend until there is game changing news
  FxWirePro: EUR/ NZD consolidating around 2.0180 room for further gains
  FxWirePro:NZD/USD drifts lower, could be on verge of bigger drop
  Bitcoin Battles Volatility: Institutional Support Eyes USD 64,000 Floor Amid Geopolitical Tensions
  Bitcoin Recovers Amid Easing Geopolitics: Bulls Target USD 80,000 Support Rebound
  FxWirePro: USD/JPY firms as Trump's address on Gulf war spark fresh concerns
  FxWirePro: GBP/USD recovers but bears are not done yet again
  Ethereum Reclaims $2,000 Handle: ETHUSD Stabilizes as Bulls Eye a Recovery
  Ethereum Retreats Toward USD 2,000: Technicals Signal Caution as ETH Mimics Bitcoin’s Pullback


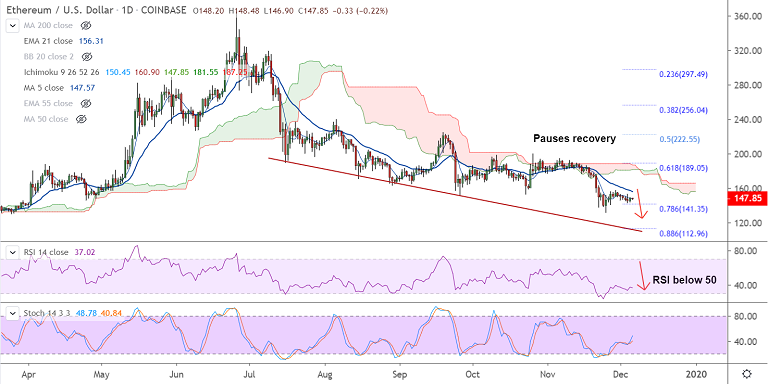
ETH/USD chart - Trading View
Exchange - Coinbase
Support: 141.35 (61.8 Fib); Resistance: 149.77 (200H MA)
Technical Analysis: Bias Bearish
ETH/USD has paused recovery and was trading marginally lower at 147.56 at 07:00 GMT.
Recovery attempts in the pair were capped at 200H MA, and the pair was trading rangebound around 5-DMA.
Technical indicators on the intraday charts have gone directionless, volatility is also shrinking.
That said, major trend remains bearish. MACD is well in the negative territory. RSI converges with price action, supporting bearish bias.
78.6% Fib is immediate support at 141.35, break below could see drag till 113 (88.6% Fib).
Decisive close above 5-DMA (147.56) will see next hurdle at 200H MA at 149.77. Decisive break above 200H MA to see more upside.


