


 EUR/JPY Breaks Out: Euro Surges Past 185.00 Resistance Amid Strong Bullish Momentum
  FxWirePro- Woodies Pivot(Major)
  Bitcoin's Tug-of-War: Bulls Eye 80,000 USD Despite Turbulent ETF Outflows
  FxWirePro- Major Pair levels and bias summary
  FxWirePro: USD/CNY falls to three-year high, scope for further downside
  Ethereum Reclaims Higher Ground: Ether Bulls Target $2,700 as Middle East Tensions Thaw
  GBPJPY Surges to 211.88: Sterling Bulls Target 215 Amid Broad-Based Buying
  FxWirePro: AUD/USD spikes as Trump announces two-week Iran ceasefire
  FxWirePro: GBP/USD stuck in range but maintains bearish bias
  Ethereum Joins the Rally: ETH Reclaims USD 2,100 Following Bitcoin's Lead
  FxWirePro: EUR/AUD falls below 1.6600 level, plunge to test a key fibo grows
  Ethereum Braces for Volatility: Technicals Turn Bearish as Geopolitical Tensions Loom


 - EconoTimes)


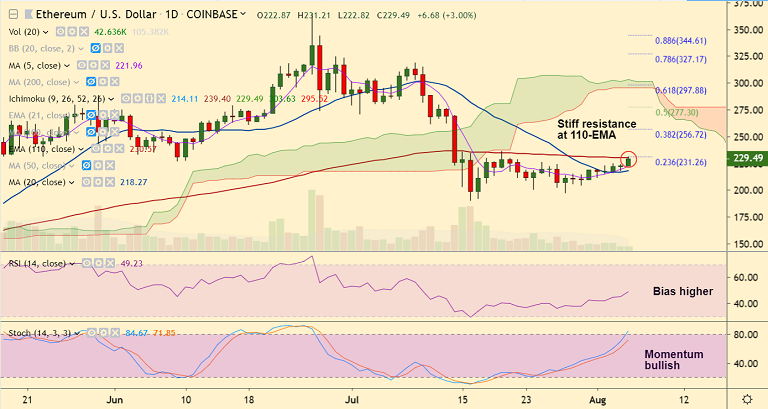
ETH/USD chart - Trading View
Exchange - Coinbase
Support: 218.24 (20-DMA); Resistance: 240.09 (55-EMA)/ 256.72 (38.2% Fib)
Technical Analysis: Bias Slightly Bullish
Ethereum is tracking gains in the kingcoin, opens the week on a bullish note.
ETH/USD spiked around 3% higher on the day to hit highs of 231.21 before paring some gains.
The pair edges lower from 3-week highs at 231.21, trades at 228.91 at 07:00 GMT.
Stiff resistance seen at 231 (nearly converged 110-EMA and 23.6% Fib).
Technical indicators on the daily charts are turning slightly bullish. Stochs and RSI are biased higher.
MACD shows a bullish crossover on signal line and positive DMI shows crossover on negative DMI.
The pair has resumed upside with a 'Dragonfly Doji' formation on the weekly charts.
Break above 110-EMA resistance will see further upside. Next bull target lies at 55-EMA at 240 ahead of 38.2% Fib at 256.72.
Rejection at 110-EMA and break below 20-DMA support (218.24) negates bullish bias.


