


 Bitcoin Battles Volatility: Institutional Support Eyes USD 64,000 Floor Amid Geopolitical Tensions
  FxWirePro: USD/ JPY slips as yen rallies after Mideast ceasefire declaration
  Aussie Bulls Charge: AUD/JPY Rallies as Geopolitical Clouds Part
  Ethereum Braces for Volatility: Technicals Turn Bearish as Geopolitical Tensions Loom
  FxWirePro:NZD/USD jumps as RBNZ warns of higher OCR potential
  Ethereum Retreats Toward USD 2,000: Technicals Signal Caution as ETH Mimics Bitcoin’s Pullback
  FxWirePro: EUR/ NZD downside pressure builds, key support level in focus
  FxWirePro- Major Crypto levels and bias summary
  FxWirePro- Major Pair levels and bias summary
  FxWirePro- Major European Indices
  FxWirePro: GBP/USD climbs to 4 -week high as ceasefire deal gives bulls traction
  GBPJPY Surges to 211.88: Sterling Bulls Target 215 Amid Broad-Based Buying


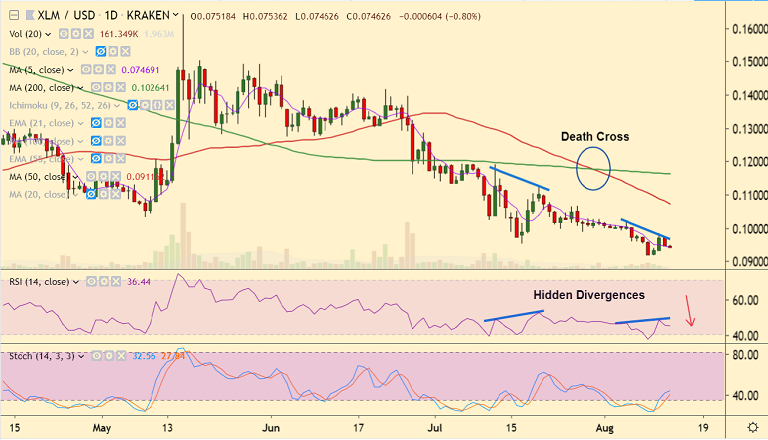
XLM/USD chart - Trading View
Exchange - Kraken
Support: 0.0665 (Feb 6 low); Resistance: 0.0808 (21-EMA)
Technical Analysis: Bias Bearish
Stellar Lumens set to extend weakness. Hidden 'Bearish Divergence' to support more downside.
XLM/USD trades extremely range-bound on the day with session highs at 0.0753 and lows at 0.0744.
Major trend in the pair is bearish as indicated by GMMA indicator.
Further, formation of 'Death Cross' (bearish 50-DMA crossover on 100-DMA) adds to the downside bias.
Recovery attempts lack traction. Price has failed to extend break above 200H SMA.
Scope for test of next major support at 0.0665 (Feb 6 low). Break above 21-EMA (0.0808) will see minor upside.


