


 FxWirePro: USD/CAD runs out of steam but maintains bullish outlook
  Ethereum Retreats Toward USD 2,000: Technicals Signal Caution as ETH Mimics Bitcoin’s Pullback
  Bitcoin on Edge: Geopolitical Tensions Weigh on BTC as Bulls Eye the USD 64,000 "Buy the Dip" Zone
  FxWirePro: AUD/USD downside pressure builds, key support level in focus
  Ethereum Rises on Geopolitical De-escalation: Pezeshkian’s Peace Signal Ignites Bullish Momentum
  Euro Retreats as Geopolitical Tensions Surge: EURUSD Eyes 1.1400 Floor Amid Safe-Haven Demand
  Bitcoin’s High-Stakes Volatility: BTCUSD Navigates Geopolitical Storms
  FxWirePro- Major European Indices
  FxWirePro: EUR/AUD gaining momentum for a move towards 1.6800 level
  Ethereum in Consolidation: ETH Trapped in Narrow Range as Bulls Await the USD 2,000 "Buy the Dip" Opportunity
  FxWirePro: GBP/USD recovers but bears are not done yet again
  Bitcoin Battles Volatility: Institutional Support Eyes USD 64,000 Floor Amid Geopolitical Tensions


, bias neutral - EconoTimes)


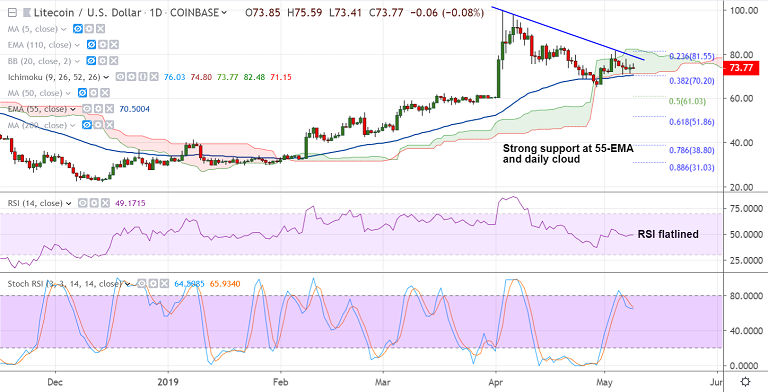
LTC/USD chart - Trading View
Exchange - Coinbase
Support: 70.50 (55-EMA); Resistance: 79 (Trendline)
Technical Analysis: Bias Neutral
- LTC/USD extends sideways grind, finds strong support at 55-EMA and daily cloud
- Technical indicators are biased neutral, RSI flatlined around 50 mark
- The pair is extending retrace from near $100 mark (hit $ 99.89 on Apr 3rd trade)
- Break below 55-EMA and daily cloud will see further weakness. Dip till 50% Fib at 61 then likely
- Upside momentum is likely to gain traction only above $79 mark (strong trendline resistance)
For details on FxWirePro's Currency Strength Index, visit http://www.fxwirepro.com/currencyindex.

- News

- Economy

- Central Banks
- Investing
- Research
- Roundups
- Digital Currency
- Insights
- Technical Analysis
- Technology
- Business
- Law
- Health
- Nature
- Fintech
- Science
- Topic
- Opinions
- ©Econometrics LLC . All Rights Reserved.
Crypto Technicals: LTC/USD extends sideways above 55-EMA (70.50), bias neutral
Thursday, May 9, 2019 10:42 AM UTC
Editor's Picks


- Market Data
Most Popular

2


