


 Euro Bulls Charge Past 1.1600: Broad Dollar Sell-Off Ignites Powerful EURUSD Rally
  FxWirePro: EUR/ NZD loses momentum but outlook is bullish
  Ethereum Rises on Geopolitical De-escalation: Pezeshkian’s Peace Signal Ignites Bullish Momentum
  FxWirePro: USD/CNY dips as China’s yuan strengthens on Iran war de escalation hopes
  Yen Resurgence Drives GBPJPY to 2.5-Week Low: Sellers Aim for 208.00
  FxWirePro: GBP/NZD uptrend loses momentum but bullish setup remains
  AUDJPY Pullback Intensifies: Resistance at 110.00 Signals Short Opportunity
  Ethereum Trails Bitcoin’s Retreat: Key Support Levels in Focus
  FxWirePro- Major European Indices


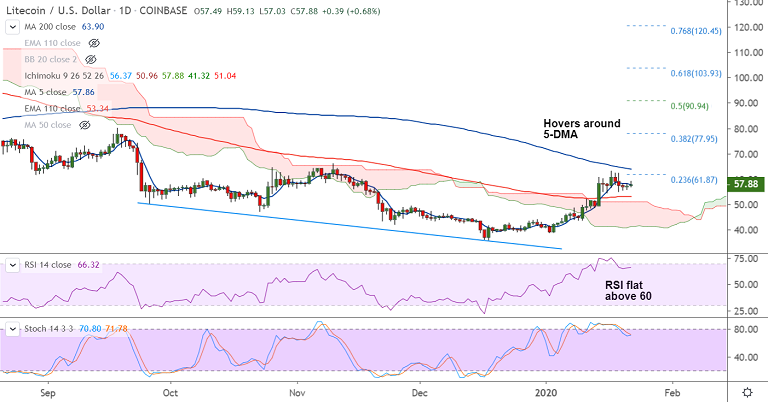
LTC/USD chart - Trading View
Exchange - Coinbase
Technical Analysis: Bias Bullish
GMMA Indicator: Major Trend - Bullish; Minor Trend - Bullish
Overbought/ Oversold Index: Neural
Volatility: Shrinking
Support: 52.71 (21-EMA); Resistance: 63.90 (200-DMA)
LTC/USD was trading 1.03% higher at 58.08 at around 09:50 GMT, bias is bullish.
The pair has retraced brief dip below 200H MA, scope for upside resumption.
Price action holds above daily cloud and correction has paused above 110-EMA.
Momentum studies are bullish. Stochs and RSI have again turned bullish after minor correction from overbought levels.
Major and minor trend as evidenced by GMMA indicator are bullish and resumption of upside will see test of 200-DMA at 63.90.
110-EMA is strong support at 53.34. Breach below cloud will see bullish invalidation.


