


 FxWirePro: USD/ZAR sustains gains as uptrend remains strong
  Ethereum Retreats Toward USD 2,000: Technicals Signal Caution as ETH Mimics Bitcoin’s Pullback
  Bitcoin on Edge: Geopolitical Tensions Weigh on BTC as Bulls Eye the USD 64,000 "Buy the Dip" Zone
  FxWirePro: EUR/AUD gaining momentum for a move towards 1.6800 level
  FxWirePro- Major Crypto levels and bias summary
  FxWirePro: USD/JPY firms as Trump's address on Gulf war spark fresh concerns
  NZDJPY Bears Take Control: New Zealand Dollar Retreats as 92 Resistance Holds Firm
  FxWirePro- Woodies Pivot(Major)
  FxWirePro: USD/ZAR fibo rejection triggers sizeable pullback
  FxWirePro: EUR/ NZD steadies around 2.0150, retains bid tone
  FxWirePro- Major Pair levels and bias summary


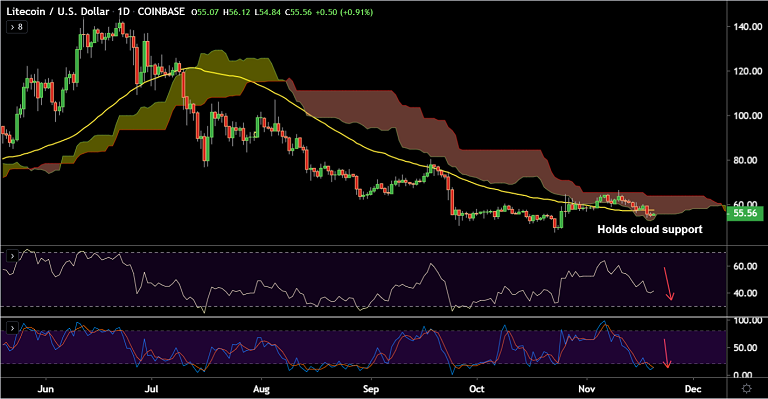
LTC/USD chart - Trading View
Exchange - Coinbase
Support: 53.36 (Cloud base); Resistance: 56.80 (5-DMA)
Technical Analysis: Bias Bearish
LTC/USD has paused 2 straight sessions of downside, more weakness on charts.
The pair was trading 1.34% higher at 55.80 at 07:10 GMT after closing 1.18% lower in the previous session.
Technical indicators are still largely bearish. Upside lacks traction. Series of strong resistances upto 59.78.
Price action is holding support at daily cloud (currently at 53.36). Breach below will see resumption of weakness.
Major supports on the downside lie at 50.25 (Sept 26 low), 47.22 (Oct 23 low) and 41.43 (Lower BB W).
5-DMA is immediate resistance at 56.77. Break above could see gains till 55-EMA at 60.34.


