


 Ethereum Rises on Geopolitical De-escalation: Pezeshkian’s Peace Signal Ignites Bullish Momentum
  Sterling’s Six-Week Streak Snaps: GBPJPY Slumps Toward 210.00 as Bearish Momentum Intensifies
  Yen Resurgence Drives GBPJPY to 2.5-Week Low: Sellers Aim for 208.00
  Bitcoin Recovers Amid Easing Geopolitics: Bulls Target USD 80,000 Support Rebound
  Ethereum Trails Bitcoin’s Retreat: Key Support Levels in Focus
  NZDJPY Technical Outlook: Bearish Bias Deepens as Key Resistances Hold
  AUDJPY Pullback Intensifies: Resistance at 110.00 Signals Short Opportunity
  FxWirePro: GBP/AUD runs out of steam but maintains bullish outlook
  FxWirePro: USD/ZAR fibo rejection triggers sizeable pullback
  AUDJPY Pullback Intensifies: Resistance at 110.00 Signals Short Opportunity


, 'Golden Cross' on hourly charts raises scope for upside - EconoTimes)


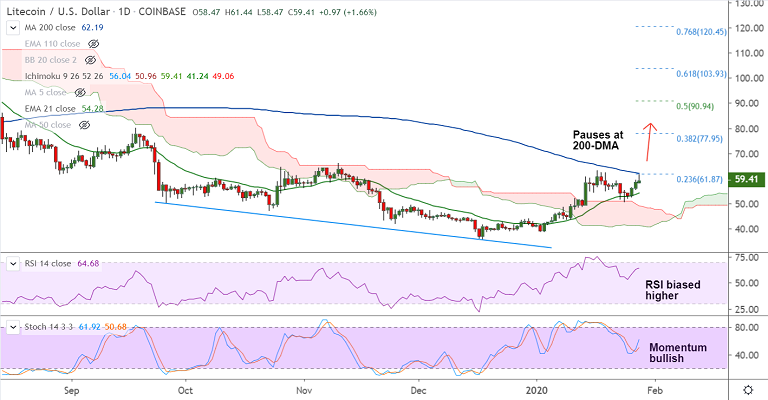
LTC/USD chart - Trading View
Exchange - Coinbase
Technical Analysis: Bias Bullish
GMMA Indicator: Major Trend - Bullish; Minor Trend - Bullish
Overbought/ Oversold Index: Neutral
Volatility: High, Shrinking
Support: 56.33 (5-DMA); Resistance: 62.19 (200-DMA)
LTC/USD was trading 1.98% higher on the day at 59.60 at 07:00 GMT, slightly lower from session highs at 61.44.
The pair is extending gains for the 3rd consecutive session and technical indicators have turned bullish for the near-term.
The pair has bounced off daily cloud support with a 'dragonfly Doji' formation and 'Golden Cross' on the hourly charts adds to the upside bias.
Price action has broken above stiff resistance at 55W EMA and is on track to test 200-DMA at 62.19.
Major and minor trend as evidenced by GMMA indicator are biased higher. Break above 200-DMA to buoy bulls.
200-DMA breakout will support a sustained upside.Next bull target aligns at 55W EMA at 66.15 ahead of 38.2% Fib at 77.95.
Failure at 200-DMA and break below 21-EMA support at 54.27 negates near-term upside bias


