


 FxWirePro- Woodies Pivot(Major)
  FxWirePro- Major Crypto levels and bias summary
  FxWirePro:NZD/USD drifts lower, could be on verge of bigger drop
  FxWirePro: USD/ZAR fibo rejection triggers sizeable pullback
  FxWirePro: USD/CNY gains some ground but bearish outlook persists
  FxWirePro: EUR/AUD retreats slightly but trend is still bullish
  AUDJPY Pullback Intensifies: Resistance at 110.00 Signals Short Opportunity
  FxWirePro: USD/JPY firms as Trump's address on Gulf war spark fresh concerns
  Ethereum in Consolidation: ETH Trapped in Narrow Range as Bulls Await the USD 2,000 "Buy the Dip" Opportunity
  Bitcoin on Edge: Geopolitical Tensions Weigh on BTC as Bulls Eye the USD 64,000 "Buy the Dip" Zone
  Ethereum Trails Bitcoin’s Retreat: Key Support Levels in Focus


 - EconoTimes)


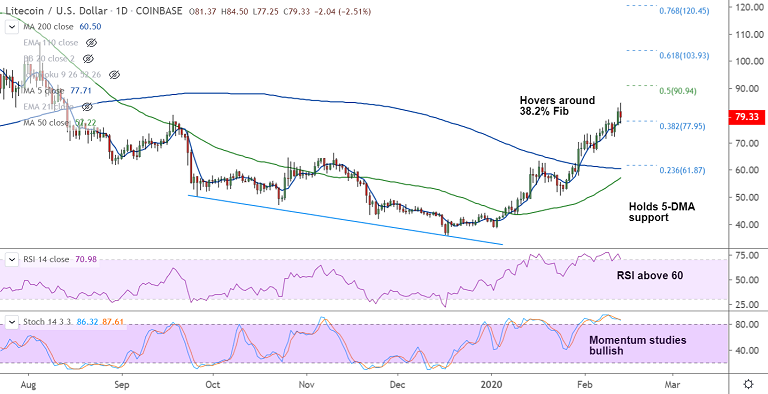
LTC/USD chart - Trading View
Exchange - Coinbase
Technical Analysis: Bias Bullish
GMMA Indicator: Major Trend - Bullish; Minor Trend - Bullish
Overbought/ Oversold Index: Overbought
Volatility: High
Support: 75.33 (200H MA); Resistance: 84.09 (weekly cloud)
LTC/USD has erased gains on the day, was trading 2.81% lower at 79.17 at around 10:25 GMT.
The pair is slipping lower in sync with the broader crypto market correction. That said, bias remains bullish.
The pair finds strong support at 200H MA at 75.33. Breach at 200H MA support could drag prices lower.
Next major support lies at 21-EMA at 70.07. Break below could see dip till 200-DMA at 60.50,
For now, the pair does not show any major signs of reversal. Correction likely to be limited.


