


 FxWirePro: USD/CNY falls to three-year high, scope for further downside
  Pound Sterling Power: GBP/JPY Secures Third Day of Gains as Global Risk Tensions Recede
  Bitcoin Breaks the $70,000 Barrier: Bulls Target the $80,000 Horizon as Geopolitical Relief Ignites Crypto Markets
  FxWirePro- Woodies Pivot(Major)
  Bitcoin's Tug-of-War: Bulls Eye 80,000 USD Despite Turbulent ETF Outflows
  FxWirePro: GBP/NZD reverses course, bias back to downside
  FxWirePro- Major Pair levels and bias summary
  NZDJPY Bearish Breakdown: Why Selling the Rallies is the Strategic Play
  FxWirePro- Major Crypto levels and bias summary
  FxWirePro: USD/ZAR continues to recovers , upside pressure builds
  Ethereum Braces for Volatility: Technicals Turn Bearish as Geopolitical Tensions Loom
  Ethereum Retreats Toward USD 2,000: Technicals Signal Caution as ETH Mimics Bitcoin’s Pullback


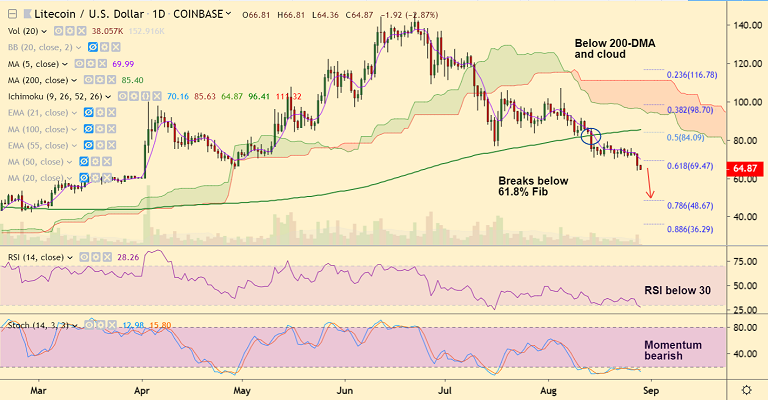
LTC/USD chart - Trading View
Exchange - Coinbase
Support: 57.06 (Mar 26 low); Resistance: 69.47 (61.8% Fib)
Technical Analysis: Bias Bearish
Litecoin hits 21-week lows below $65, bias strongly bearish.
LTC/USD is extending weakness below 200-DMA, price action slips below 61.8% Fib.
Major trend in the pair is bearish. Volatility is rising. Momentum with the bears.
Potential 'Death Cross' (bearish 50-DMA crossover on 200-DMA) keeps downside pressure.
The pair has broken major support at 110W EMA at 71.52. Scope for test of 78.6% Fib at 48.67.
Failure to close below 110W EMA could see some consolidation. Break above 200-DMA (85.40) negates bearish bias.


