


 Euro Retreats as Geopolitical Tensions Surge: EURUSD Eyes 1.1400 Floor Amid Safe-Haven Demand
  Ethereum Joins the Rally: ETH Reclaims USD 2,100 Following Bitcoin's Lead
  Ethereum in Consolidation: ETH Trapped in Narrow Range as Bulls Await the USD 2,000 "Buy the Dip" Opportunity
  FxWirePro: USD/ZAR sustains gains as uptrend remains strong
  FxWirePro- Major Pair levels and bias summary
  FxWirePro- Major Crypto levels and bias summary
  Bitcoin on Edge: Geopolitical Tensions Weigh on BTC as Bulls Eye the USD 64,000 "Buy the Dip" Zone
  FxWirePro:NZD/USD drifts lower, could be on verge of bigger drop
  NZDJPY Bears Take Control: New Zealand Dollar Retreats as 92 Resistance Holds Firm


 breaks above 200-DMA, bias turning bullish - EconoTimes)


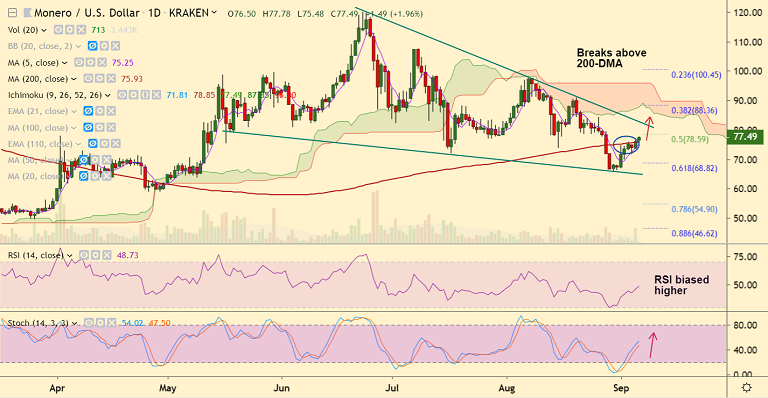
XMR/USD chart - Trading View
Exchange - Kraken
Support: 75.93 (200-DMA); Resistance: 82.75 (trendline)
Technical Analysis: Bias Bullish
XMR/USD has shown a break above 200-DMA after many days of consolidation below.
Technical indicators have turned bullish, scope for further upside.
Stochs and RSI have rolled over from oversold levels and are biased higher.
MACD is showing a bullish crossover on signal line and the pair has broken above major EMAs and cloud on the 4H charts.
Close above 200-DMA will take the pair higher, raising scope for test of trendline resistance at 82.75.
On the flipside, failure to hold above 200-DMA will see sideways trade for longer. Break below 5-DMA will see weakness in the pair.


