


 Bitcoin Resilience: BTC Reclaims USD 69,000 as Geopolitical Tensions Ease
  Ethereum Braces for Volatility: Technicals Turn Bearish as Geopolitical Tensions Loom
  FxWirePro- Major European Indices
  Bitcoin Breaks the $70,000 Barrier: Bulls Target the $80,000 Horizon as Geopolitical Relief Ignites Crypto Markets
  NZD/JPY Rockets as Kiwi Dollar Resilience Defies the Oil Shock
  FxWirePro- Major Crypto levels and bias summary
  FxWirePro- Major Pair levels and bias summary
  Pound Sterling Power: GBP/JPY Secures Third Day of Gains as Global Risk Tensions Recede
  FxWirePro: USD/CNY falls to three-year high, scope for further downside
  FxWirePro: USD/ZAR continues to recovers , upside pressure builds
  FxWirePro- Major Pair levels and bias summary


 recovery falters at major trendline resistance, slips below cloud - EconoTimes)


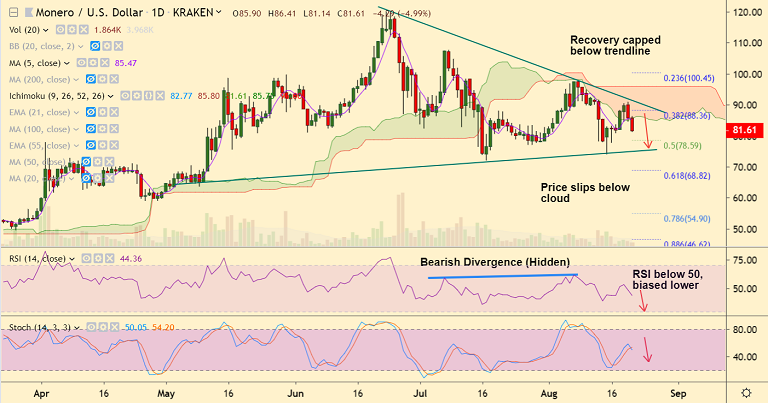
XMR/USD chart - Trading View
Exchange - Kraken
Support: 75.35 (trendline); Resistance: 85.75 (cloud base)
Technical Analysis: Bias Bearish
XMR/USD slumps lower for the second straight session, trades around 5% lower at 81.61 at 07:25 GMT.
Recovery in the pair was capped below major trendline resistance and the pair has slipped below daily cloud.
Price action has retraced break above 200H SMA, and volatility is rising on the intraday charts.
Momentum with the bears. RSI is well below 50 levels and biased lower. Hidden bearish divergence on RSI likely to plummet prices.
Scope for test of immediate support at 78.59 (50% Fib). Further weakness will see dip till trendline support at 75.35.
Major trend is sideways. Price action rages in 'Symmetric Triangle' pattern. Breakout will provide clear directional bias.


