


 FxWirePro: GBP/NZD range to extend until there is game changing news
  FxWirePro- Major Pair levels and bias summary
  Euro Bulls Charge Past 1.1600: Broad Dollar Sell-Off Ignites Powerful EURUSD Rally
  Bitcoin Recovers Amid Easing Geopolitics: Bulls Target USD 80,000 Support Rebound
  FxWirePro- Major Crypto levels and bias summary
  FxWirePro: GBP/USD recovers but bears are not done yet again
  Ethereum in Consolidation: ETH Trapped in Narrow Range as Bulls Await the USD 2,000 "Buy the Dip" Opportunity
  Bitcoin Battles Volatility: Institutional Support Eyes USD 64,000 Floor Amid Geopolitical Tensions
  FxWirePro- Major Crypto levels and bias summary
  Ethereum Retreats Toward USD 2,000: Technicals Signal Caution as ETH Mimics Bitcoin’s Pullback
  FxWirePro- Woodies Pivot(Major)
  FxWirePro- Major Crypto levels and bias summary
  FxWirePro- Major Crypto levels and bias summary


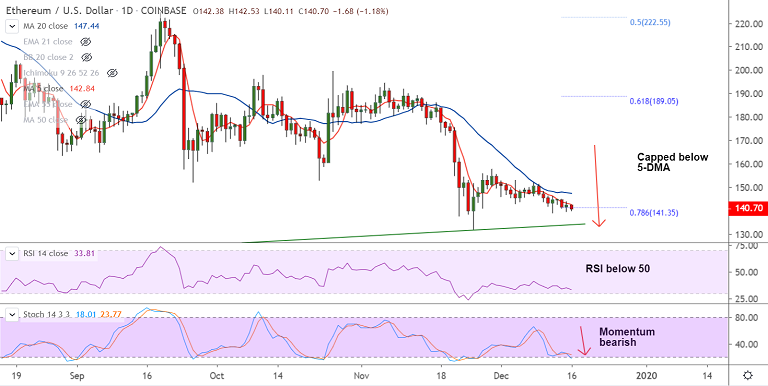
ETH/USD chart - Trading View
Exchange - Coinbase
Support: 133.50 (Trendline); Resistance: 142.84 (5-DMA)
Technical Analysis: Bias Bearish
ETH/USD is extending weakness on the day, bears largely ignore 'Spinning Top' formation on the previous day's candle.
The pair was trading 1.05% lower at 140.88 at 08:50 GMT, after closing 0.46% higher in the previous session.
Upside remains capped at 5-DMA, technical indicators are biased lower, momentum with the bears.
Stochs are sharply lower, RSI is well below 50 mark. MACD in deep negative territory adds to the bearish bias.
Bearish technical indicators with rising volatility to plummet prices. Dip till trendline support at 133.50 likely.
Stiff resistance lies at at 200H MA at 145. Break above will see a shift near-term dynamics.


