


 FxWirePro- Woodies Pivot(Major)
  FxWirePro- Major European Indices
  Bitcoin on Edge: Geopolitical Tensions Weigh on BTC as Bulls Eye the USD 64,000 "Buy the Dip" Zone
  FxWirePro: USD/CNY gains some ground but bearish outlook persists
  FxWirePro: USD/JPY firms as Trump's address on Gulf war spark fresh concerns
  FxWirePro- Major Crypto levels and bias summary
  Bitcoin Battles Volatility: Institutional Support Eyes USD 64,000 Floor Amid Geopolitical Tensions
  FxWirePro: EUR/AUD gaining momentum for a move towards 1.6800 level
  FxWirePro: EUR/AUD eases slightly but trend is still bullish
  FxWirePro- Major Crypto levels and bias summary
  FxWirePro- Major Pair levels and bias summary
  Ethereum Reclaims $2,000 Handle: ETHUSD Stabilizes as Bulls Eye a Recovery


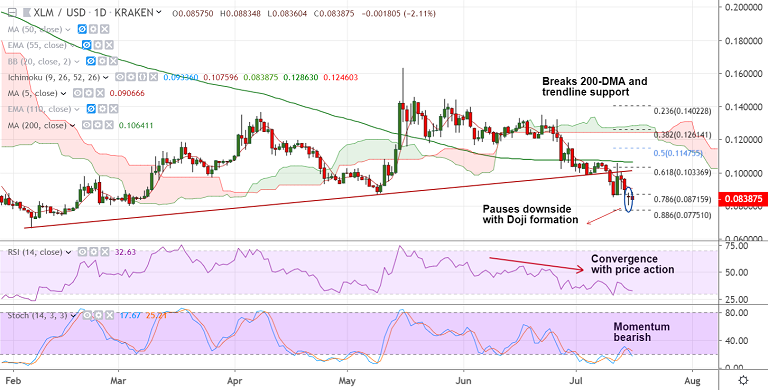
XLM/USD chart - Trading View
Exchange - Kraken
Support: 0.08 (Mar 4th low); Resistance: 0.0911 (5-DMA)
Technical Analysis: Bias Bearish
XLM/USD trades 1.62% lower on the day at 0.0842 at 12:50 GMT, major trend is bearish.
The pair has retraced from session highs at 0.0883, scope for further downside.
Price action extending weakness below 200-DMA. Convergence of RSI with price action adds to downside pressure.
The pair is attempting minor recovery after Doji formation on Monday's candle.
However, recovery attempts lack traction. Upside rejected at session highs.
Next major support lies at 88.6% Fib at 0.0775. Break below eyes 2019 lows at 0.0665.
For details on FxWirePro's Currency Strength Index, visit http://www.fxwirepro.com/currencyindex.


