


 Bitcoin Breaks the $70,000 Barrier: Bulls Target the $80,000 Horizon as Geopolitical Relief Ignites Crypto Markets
  Pound Sterling Power: GBP/JPY Secures Third Day of Gains as Global Risk Tensions Recede
  FxWirePro: GBP/NZD reverses course, bias back to downside
  Ethereum Braces for Volatility: Technicals Turn Bearish as Geopolitical Tensions Loom
  Ethereum Reclaims Higher Ground: Ether Bulls Target $2,700 as Middle East Tensions Thaw
  EUR/JPY Breaks Out: Euro Surges Past 185.00 Resistance Amid Strong Bullish Momentum
  FxWirePro- Major Crypto levels and bias summary
  FxWirePro: GBP/USD stuck in range but maintains bearish bias
  FxWirePro: GBP/AUD downtrend extends, eyes 1.8900 evel
  FxWirePro- Woodies Pivot(Major)
  Aussie Ascent: AUDJPY Charges Toward 112 as Bullish Momentum Hits Five-Day High


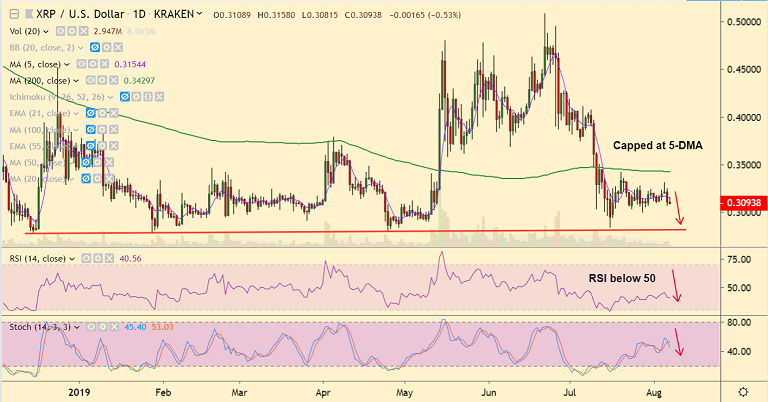
XRP/USD chart - Trading View
Exchange - Kraken
Support: 0.2820 (Trendline); Resistance: 0.3222 (21-EMA)
Technical Analysis: Bias turning bearish
XRP/USD is extending weakness for the second straight session, bias is turning bearish.
Price action has been grinding sideways after break below 200-DMA.
Upside recovery finds strong selling pressure as evidenced by 'Inverted Hammer' formation.
RSI is below 50 and GMMA shows major trend has shifted to bearish.
Stochastics RSI is at overbought levels and on verge of rollover into neutral.
Expect prices to fall in sync. Scope for test of major trendline support at 0.2820.
21-EMA is strong resistance at 0.3222. Break above 200-DMA (0.3429) could negate near-term bearishness.


