


 FxWirePro: USD/ JPY slips as yen rallies after Mideast ceasefire declaration
  Ethereum Reclaims Higher Ground: Ether Bulls Target $2,700 as Middle East Tensions Thaw
  FxWirePro: EUR/AUD falls below 1.6600 level, plunge to test a key fibo grows
  FxWirePro: GBP/USD stuck in range but maintains bearish bias
  Ethereum Braces for Volatility: Technicals Turn Bearish as Geopolitical Tensions Loom
  FxWirePro- Major Crypto levels and bias summary
  FxWirePro- Woodies Pivot(Major)
  Bitcoin's Tug-of-War: Bulls Eye 80,000 USD Despite Turbulent ETF Outflows
  EUR/JPY Breaks Out: Euro Surges Past 185.00 Resistance Amid Strong Bullish Momentum
  FxWirePro: USD/ZAR continues to recovers , upside pressure builds
  FxWirePro: GBP/NZD reverses course, bias back to downside
  FxWirePro- Major Crypto levels and bias summary
  FxWirePro- Woodies Pivot(Major)
  Bitcoin Resilience: BTC Reclaims USD 69,000 as Geopolitical Tensions Ease


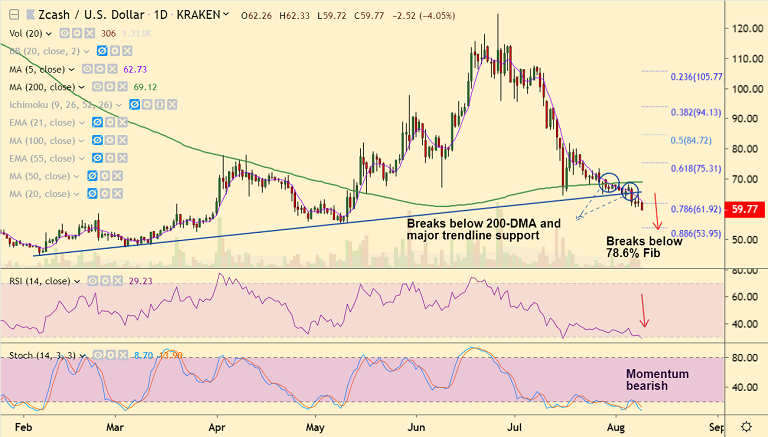
ZEC/USD chart - Trading View
Exchange - Kraken
Support: 53.95 (88.6% Fib); Resistance: 69.12 (200-DMA)
Technical Analysis: Bias Bearish
ZEC/USD was trading 3.72% lower on the day at 59.97 at 10:00 GMT, bias is bearish.
'Gravestone Doji' on previous day's candle shows selling pressure at highs, plummets prices.
GMMA indicator and the Parabolic SAR suggest extension of downtrend. Momentum studies are bearish.
The pair has slipped below 78.6% Fib and eyes next major support at 55.24 (May 9th lows) ahead of 88.6% Fib at 53.95.
5-DMA is immediate resistance at 62.76. Retrace above 200-DMA (69.12) negates near-term bearishness.


