


 EUR/JPY Bulls Charge: Eyeing 186.00 as Euro Strength Intensifies
  FxWirePro: GBP/NZD range to extend until there is game changing news
  FxWirePro: USD/CNY gains some ground but bearish outlook persists
  FxWirePro- Major Crypto levels and bias summary
  FxWirePro: EUR/ NZD steadies around 2.0150, retains bid tone
  FxWirePro- Woodies Pivot(Major)
  FxWirePro: GBP/USD recovers but bears are not done yet again
  FxWirePro- Major Crypto levels and bias summary
  Bitcoin’s High-Stakes Volatility: BTCUSD Navigates Geopolitical Storms
  FxWirePro: USD/ZAR sustains gains as uptrend remains strong


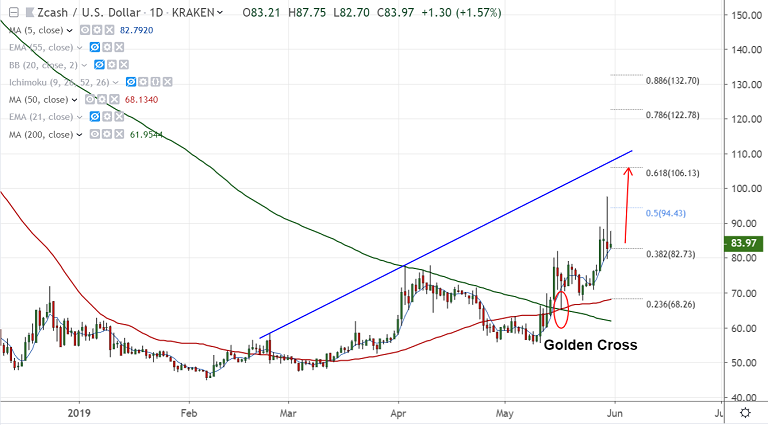
ZEC/USD chart - Trading View
Exchange - Kraken
Support: 75 (21-EMA); Resistance: 106.13 (61.8% Fib)
Technical Analysis: Bias Bullish
ZEC/USD slips lower from new 6-month highs at 97.59 hit on Thursday's trade.
Price action is holding above immediate support at 5-DMA (82.82).
Technical indicators are biased higher. Price action is above cloud and major moving averages.
A 'Golden Cross' formation on the daily charts keeps scope for upside in the pair.
Volatility is rising as evidenced by expanding Bollinger Bands.
Next major bull target lies at 61.8% Fib at 106.13 ahead of 55W-EMA at 111.30.
Break below 5-DMA finds strong support at 75 (nearly converged 20-DMA and 21-EMA).
Bullish invalidation likely on break below 200-DMA.
For details on FxWirePro's Currency Strength Index, visit http://www.fxwirepro.com/currencyindex.


