


 Euro Bulls Charge Past 1.1600: Broad Dollar Sell-Off Ignites Powerful EURUSD Rally
  FxWirePro- Major Pair levels and bias summary
  Yen Resurgence Drives GBPJPY to 2.5-Week Low: Sellers Aim for 208.00
  FxWirePro- Major European Indices
  FxWirePro: GBP/NZD range to extend until there is game changing news
  Ethereum Rises on Geopolitical De-escalation: Pezeshkian’s Peace Signal Ignites Bullish Momentum
  FxWirePro: GBP/USD gains some upside momentum but still bearish
  FxWirePro: USD/CAD runs out of steam but maintains bullish outlook
  FxWirePro- Major Crypto levels and bias summary
  FxWirePro: USD/CNY dips as China’s yuan strengthens on Iran war de escalation hopes
  FxWirePro: GBP/USD recovers but bears are not done yet again
  FxWirePro: USD/JPY neutral in the near-term, scope for downward resumption
  Bitcoin Recovers Amid Easing Geopolitics: Bulls Target USD 80,000 Support Rebound
  AUDJPY Pullback Intensifies: Resistance at 110.00 Signals Short Opportunity
  EUR/JPY Bulls Charge: Eyeing 186.00 as Euro Strength Intensifies
  FxWirePro: EUR/ NZD loses momentum but outlook is bullish


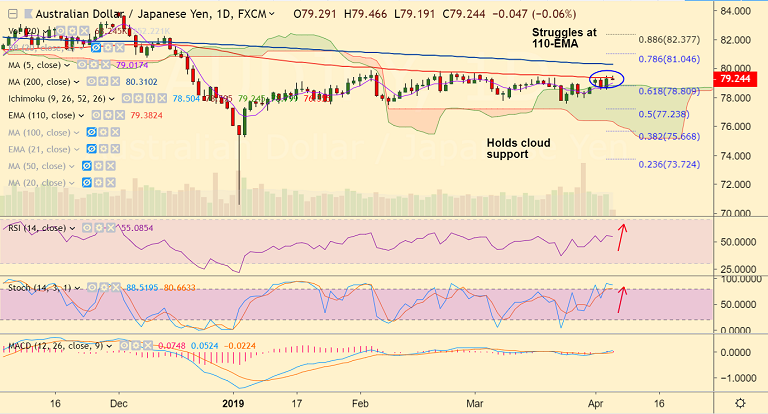
AUD/JPY chart - Trading View
- AUD/JPY is trading at 79.61 at 0827 GMT, capped below stiff resistance at 110-EMA.
- Upbeat data and signs of progress in Sino-U.S. trade talks likely to support Aussie.
- Technical indicators on daily charts are bullish. Stochs and RSI are biased higher.
- The pair has broken out of daily cloud and is holding above 5-DMA.
- 110-EMA offers stiff resistance and break above required for further upside. Scope then for test of 200-DMA at 80.32.
- Strong support is seen at 78.85 to 78.75 zone, break below will see dip till 50% Fib at 77.23.
Support levels - 78.80 (cloud top), 78.78 (21-EMA), 77.91 (Mar 28 lows), 77.23 (50% Fib)
Resistance levels - 79.38 (110-EMA), 80.30 (200-DMA), 81.04 (78.6% Fib)
Recommendation: Good to go long on break above 110-EMA, SL: 78.75, TP: 80/ 80.35/ 81
For details on FxWirePro's Currency Strength Index, visit http://www.fxwirepro.com/currencyindex.


