


AUD/NZD chart - Trading View
Technical Analysis: Bias Bearish
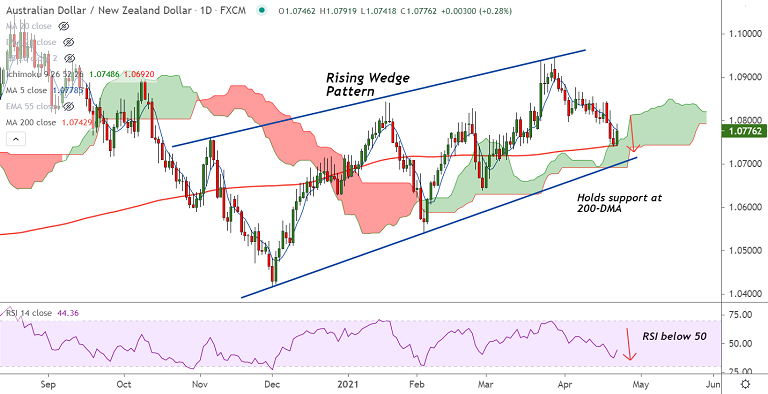
- Bounces off 200-DMA and cloud support
- GMMA indicator shows short-term trend is bearish, but major trend is neutral
- Stochs and RSI suggest bearish momentum, support downside
- Price action is within a rising wedge pattern and bounce off 200-DMA keeps scope for upside resumption
Support levels - 1.0742 (200-DMA), 1.07 (Wedge base), 1.0692 (cloud base)
Resistance levels - 1.0782 (55-EMA), 1.0806 (21-EMA), 1.0828 (20-DMA)
Summary: AUD/NZD finds major support at 200-DMA, any further weakness only on break below. Decisive break above 55-EMA will confirm upside resumption.


