


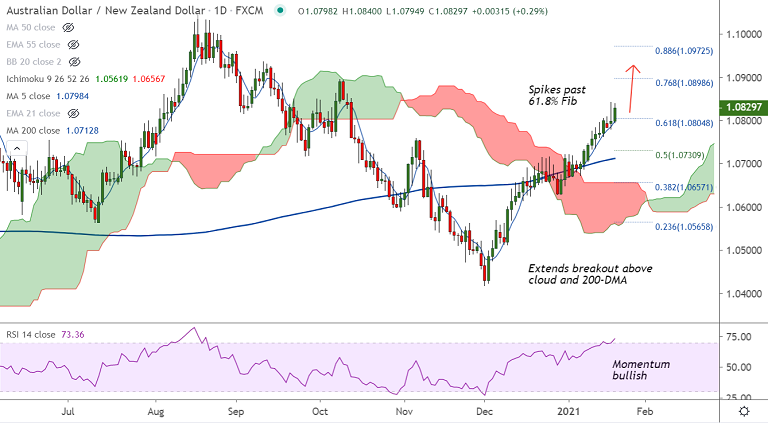
AUD/NZD chart - Trading View
Technical Analysis: Bias Bullish
- AUD/NZD spikes past 61.8% Fib, trades 0.28% higher at 1.0829 at 07:20 GMT
- Price action is above 200-DMA and daily cloud, major moving averages are biased higher
- Bollinger bands are widening, suggests rising volatility, momentum is strongly bullish
- Analysis of GMMA indicator shows minor and major trend are bullish on the daily charts
- MACD and ADX also support upside, MACD shows bullish crossover on signal line on the weekly charts
Support levels - 1.0804 (61.8% Fib), 1.0798 (5-DMA), 1.0768 (200H MA), 1.0730 (50% Fib)
Resistance levels - 1.0865 (Nov 2019 high), 1.0898 (76.8% Fib), 1.09
Summary: Stimulus hopes keep risk buoyed and support risk assets. Technical analysis for the pair is strongly bullish. Price action has spiked past 61.8% Fib and is on track to test 76.8% Fib at 1.0898.


