


 FxWirePro: GBP/USD bulls remain cautiously optimistic
  Ethereum Consolidates: Bullish Technicals Point to a Potential $3,000 Breakout
  FxWirePro- Major Pair levels and bias summary
  FxWirePro: EUR/CAD gains ground on prospects of resumed energy flows
  FxWirePro: USD/CAD recovers slightly but bearish outlook persists
  FxWirePro: EUR/AUD under pressure as key support gives way
  FxWirePro: GBP/AUD positions for another drop, eyes 1.8900level
  FxWirePro:NZD/USD uptrend loses momentum but bullish setup remains
  FxWirePro: GBP/USD biased higher but rally currently stretched
  FxWirePro- Woodies Pivot(Major)
  FxWirePro- Major Crypto levels and bias summary
  FxWirePro: AUD/USD retreats slightly but trend is still bullish
  FxWirePro: USD/CAD extends decline on broad dollar weakness
  Bitcoin’s Volatile Reset: ETFs Rebound as Bulls Eye USD 80,000 Milestone
  FxWirePro- Major European Indices


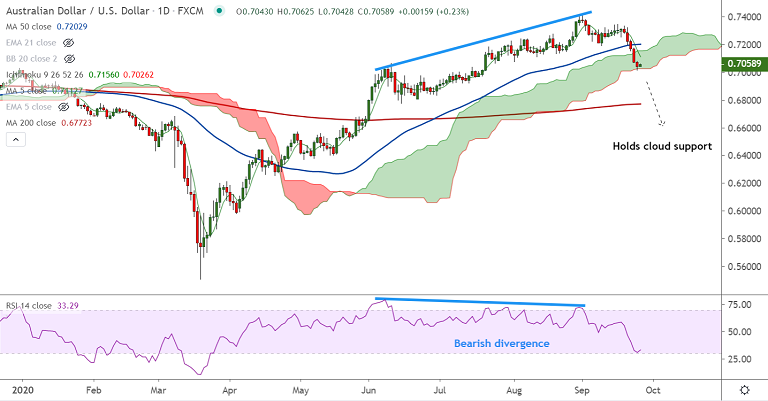
AUD/USD chart - Trading View
Technical Analysis: Bias Bearish
GMMA Indicator
- Major trend is neutral, minor trend is bearish on the daily charts
- Major trend is turning bullish, minor trend is bullish on the weekly charts
Ichimoku Analysis
- Downside price action has held support at cloud base on the daily charts
- The pair trades well above weekly cloud
Oscillators
- Stochs and RSI are biased lower on the weekly charts and are near oversold levels on the dailies
Bollinger Bands
- Widening Bollinger bands suggest rising volatility in the pair
Major Support Levels: 0.7008 (110-EMA), 0.6772 (200-DMA)
Major Resistance Levels: 0.7112 (5-DMA), 0.7131 (61.8% Fib)
Summary: Bearish bias for the pair in the near-term. Breach at daily cloud will drag the pair lower. Scope for test of 200-DMA. Violation at 200-DMA will open downside.


