


 US Gas Market Poised for Supercycle: Bernstein Analysts
  2025 Market Outlook: Key January Events to Watch
  Indonesia Surprises Markets with Interest Rate Cut Amid Currency Pressure
  S&P 500 Relies on Tech for Growth in Q4 2024, Says Barclays
  Moody's Upgrades Argentina's Credit Rating Amid Economic Reforms
  Mexico's Undervalued Equity Market Offers Long-Term Investment Potential
  Lithium Market Poised for Recovery Amid Supply Cuts and Rising Demand
  Gold Prices Fall Amid Rate Jitters; Copper Steady as China Stimulus Eyed
  Fed May Resume Rate Hikes: BofA Analysts Outline Key Scenarios
  Trump’s "Shock and Awe" Agenda: Executive Orders from Day One
  US Futures Rise as Investors Eye Earnings, Inflation Data, and Wildfire Impacts
  Moldova Criticizes Russia Amid Transdniestria Energy Crisis
  Energy Sector Outlook 2025: AI's Role and Market Dynamics
  China's Refining Industry Faces Major Shakeup Amid Challenges
  European Stocks Rally on Chinese Growth and Mining Merger Speculation
  Gold Prices Slide as Rate Cut Prospects Diminish; Copper Gains on China Stimulus Hopes


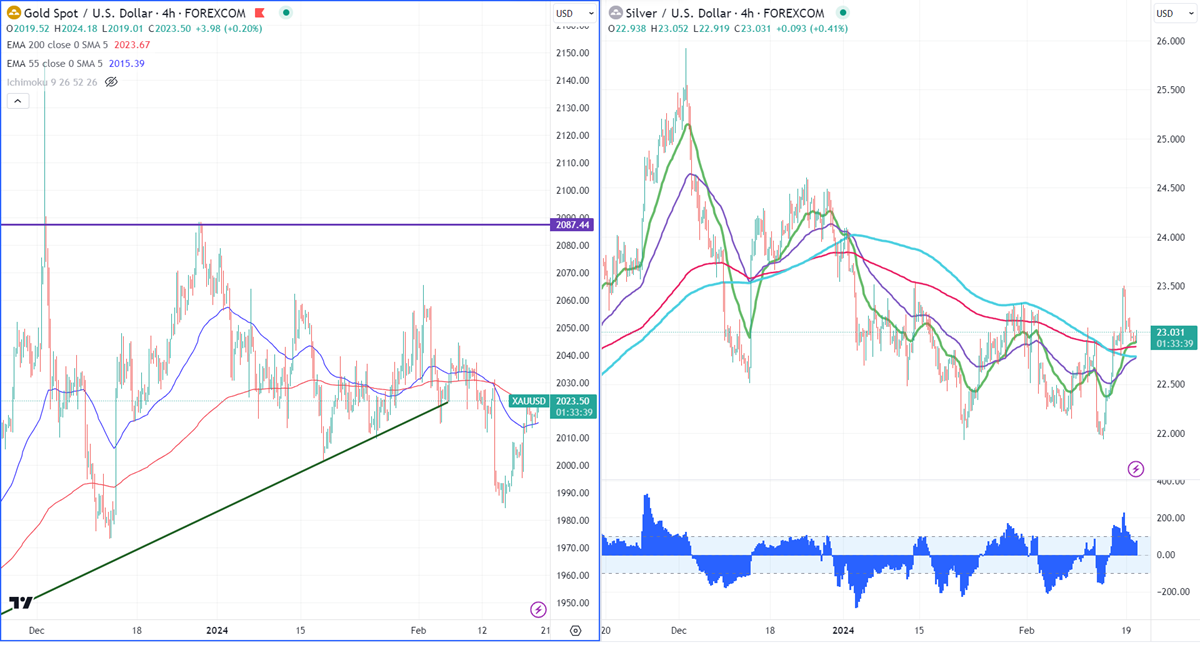
Gold -
Ichimoku Analysis (4-hour chart)
Tenken-Sen- $2019.77
Kijun-Sen- $2028.28
Gold traded flat as the US markets remained closed yesterday. With no major economic indicators to be released today. Markets await US FOMC meeting minutes for further movement. The yellow metal hit a high of $2023.16 at the time of writing and is currently trading around $2022.91.
According to the CME Fed watch tool, the probability of a no-rate cut in Mar increased to 91.50% from 84% a week ago.
US dollar index- Neutral. Minor support around 103.80/103. The near-term resistance is 105/106.
Factors to watch for gold price action-
Global stock market- Bullish (negative for gold)
US dollar index - Mixed (neutral for gold)
US10-year bond yield- Bullish (negative for gold)
Technical:
The near–term support is around $2015, a break below targets of $2000/$1970/$1956/$1930. The yellow metal faces minor resistance around $2030 and a breach above will take it to the next level of $2045/$2060/$2070/$2080/$2100.
It is good to buy on dips around $2000 with SL around $1970 for TP of $2065/$2080.
Silver-
Silver lost its shine, as a surge in inflation might delay an early rate cut. It trades above 21, 55- EMA, and 200 EMA in the 4-hour chart. The near-term support is around $22.75 and a break below confirms an intraday bearishness. A dip to $22.20/$21.90/$21.40/$20.68 is possible. Any violation above $23.60 confirms further bullishness. A jump to $24/$24.60 is possible.
Crude oil-
WTI crude oil trades stable on improved demand from China. Any close above $80 confirms a bullish continuation.
Major resistance- $80/$82.50. Significant support- $74/$72.


