


 Indonesia Surprises Markets with Interest Rate Cut Amid Currency Pressure
  U.S. Stocks vs. Bonds: Are Diverging Valuations Signaling a Shift?
  China's Refining Industry Faces Major Shakeup Amid Challenges
  2025 Market Outlook: Key January Events to Watch
  Moldova Criticizes Russia Amid Transdniestria Energy Crisis
  Bank of America Posts Strong Q4 2024 Results, Shares Rise
  Stock Futures Dip as Investors Await Key Payrolls Data
  UBS Projects Mixed Market Outlook for 2025 Amid Trump Policy Uncertainty
  US Futures Rise as Investors Eye Earnings, Inflation Data, and Wildfire Impacts
  China’s Growth Faces Structural Challenges Amid Doubts Over Data
  UBS Predicts Potential Fed Rate Cut Amid Strong US Economic Data
  Trump’s "Shock and Awe" Agenda: Executive Orders from Day One
  Global Markets React to Strong U.S. Jobs Data and Rising Yields
  Moody's Upgrades Argentina's Credit Rating Amid Economic Reforms
  Goldman Predicts 50% Odds of 10% U.S. Tariff on Copper by Q1 Close
  U.S. Treasury Yields Expected to Decline Amid Cooling Economic Pressures
  Wall Street Analysts Weigh in on Latest NFP Data


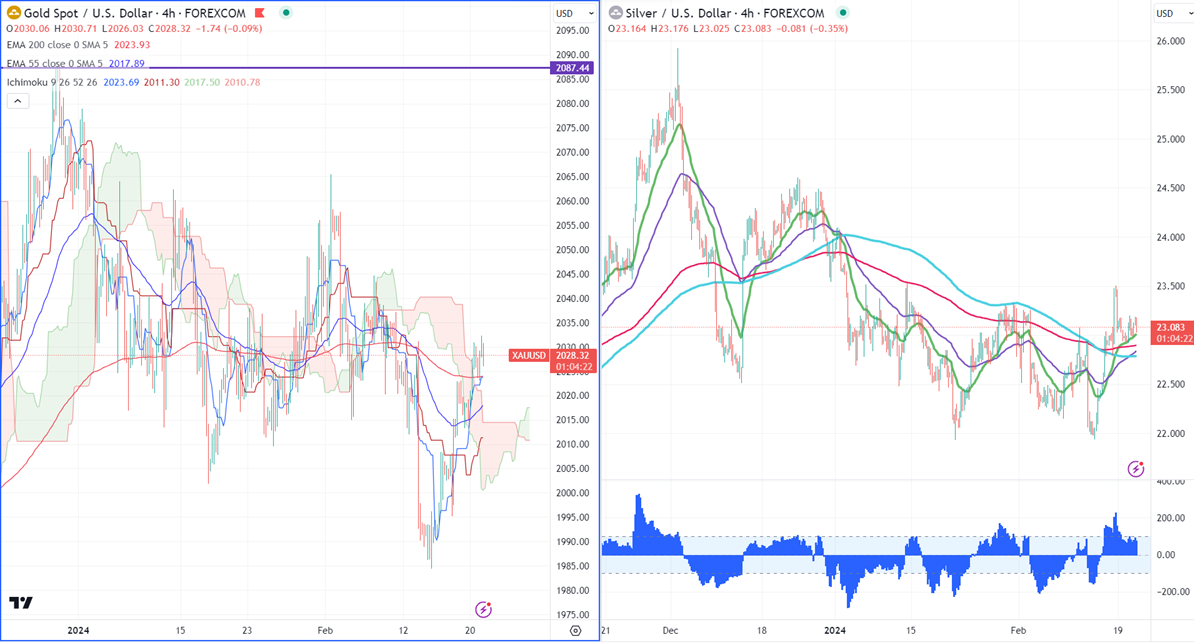
Gold -
Ichimoku Analysis (4-hour chart)
Tenken-Sen- $2023.69
Kijun-Sen- $2011.30
Gold was trading with no direction ahead of the US FOMC meeting minutes. The yellow metal hit a high of $2032.16 at the time of writing and is currently trading around $2027.
According to the CME Fed watch tool, the probability of a no-rate cut in Mar increased to 91.50% from 91% a week ago.
US dollar index- Neutral. Minor support around 103.80/103. The near-term resistance is 105/106.
Factors to watch for gold price action-
Global stock market- Bullish (negative for gold)
US dollar index - Mixed (neutral for gold)
US10-year bond yield- Bullish (negative for gold)
Technical:
The near–term support is around $2015, a break below targets of $2000/$1970/$1956/$1930. The yellow metal faces minor resistance around $2030 and a breach above will take it to the next level of $2045/$2060/$2070/$2080/$2100.
It is good to buy on dips around $2000 with SL around $1970 for TP of $2065/$2080.
Silver-
Silver is consolidating after a massive sell-off. It trades above 21, 55- EMA, and 200 EMA in the 4-hour chart. The near-term support is around $22.90 and a break below confirms an intraday bearishness. A dip to $22.50/$22.20/$21.90/$21.40/$20.68 is possible. Any violation above $23.60 confirms further bullishness. A jump to $24/$24.60 is possible.
Crude oil-
WTI crude oil pared some of its gains despite Israel's airstrike on Damascus. Any close above $80 confirms a bullish continuation.
Major resistance- $80/$82.50. Significant support- $74/$72.
a


