


 China's Refining Industry Faces Major Shakeup Amid Challenges
  China’s Growth Faces Structural Challenges Amid Doubts Over Data
  U.S. Stocks vs. Bonds: Are Diverging Valuations Signaling a Shift?
  Fed May Resume Rate Hikes: BofA Analysts Outline Key Scenarios
  Wall Street Analysts Weigh in on Latest NFP Data
  Trump’s "Shock and Awe" Agenda: Executive Orders from Day One
  U.S. Treasury Yields Expected to Decline Amid Cooling Economic Pressures
  S&P 500 Relies on Tech for Growth in Q4 2024, Says Barclays
  Indonesia Surprises Markets with Interest Rate Cut Amid Currency Pressure
  Moldova Criticizes Russia Amid Transdniestria Energy Crisis
  U.S. Banks Report Strong Q4 Profits Amid Investment Banking Surge
  Global Markets React to Strong U.S. Jobs Data and Rising Yields
  European Stocks Rally on Chinese Growth and Mining Merger Speculation
  Lithium Market Poised for Recovery Amid Supply Cuts and Rising Demand
  UBS Projects Mixed Market Outlook for 2025 Amid Trump Policy Uncertainty
  Energy Sector Outlook 2025: AI's Role and Market Dynamics
  Urban studies: Doing research when every city is different


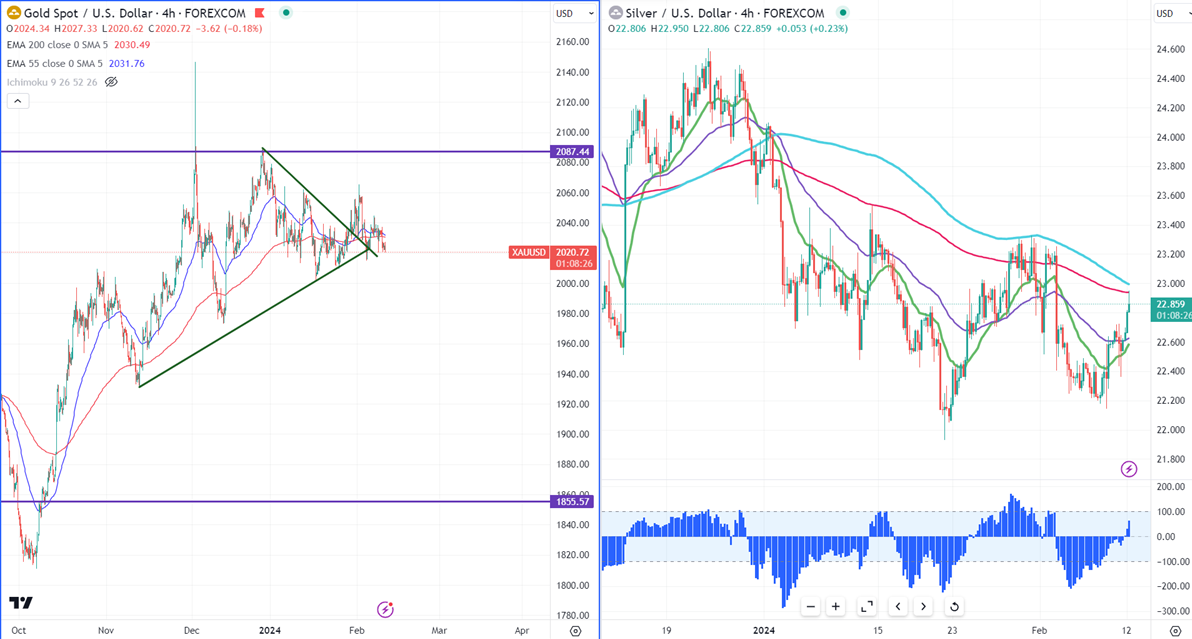
Gold -
Ichimoku Analysis (4-hour chart)
Tenken-Sen- $2028.80
Kijun-Sen- $2032.44
Gold has traded in a narrow range between $2014 and $2044.61 for the past week. The upbeat US services PMI and hawkish comments from Fed officials on rate cuts put pressure on the yellow metal. The yellow metal hit a low of $2020 at the time of writing and is currently trading around $2024.46.
According to the CME Fed watch tool, the probability of a no-rate cut in Mar increased to 82.50% from 80% a week ago.
US dollar index- Bullish. Minor support around 103.50/102.75. The near-term resistance is 104.60/106.
Factors to watch for gold price action-
Global stock market- Bullish (negative for gold)
US dollar index - bullish (negative for gold)
US10-year bond yield- Bullish (negative for gold)
Technical:
The near–term support is around $2010, a break below targets of $2000/$1970/$1956. The yellow metal faces minor resistance around $2030 and a breach above will take it to the next level of $2045/$2060/$2070/$2080/$2100.
It is good to buy on dips around $2015 with SL around $2000 for TP of $2065/$2080.
.
Silver-
Silver reversed from this month's low of $22.15. Gold-silver ratio hits multi high indicating that silver will outperform gold in the short term. It trades above 21, 55- EMA, and below 200 EMA in the 4-hour chart. The near-term resistance is around $22.95 and a break above confirms an intraday bullishness. A jump to $23.35/$23.50 is possible. On the lower side, immediate support is around $22.40 any violation below will drag the commodity to $21.90/$21.40/$20.68.
Crude oil-
WTI crude oil jumped sharply as Israel's Gaza strikes intensified.
Major resistance- $78/$80. Significant support- $74/$72.


