


 FxWirePro: USD/CAD recovers slightly but bearish outlook persists
  Bitcoin’s Volatile Reset: ETFs Rebound as Bulls Eye USD 80,000 Milestone
  FxWirePro: GBP/AUD positions for another drop, eyes 1.8900level
  FxWirePro: GBP/AUD gains some upside momentum but still bearish
  FxWirePro- Major European Indices
  FxWirePro: USD/CAD extends decline on broad dollar weakness
  FxWirePro: GBP/USD biased higher but rally currently stretched
  FxWirePro: EUR/CAD gains ground on prospects of resumed energy flows
  FxWirePro: GBP/NZD down trend loses steam, remains on bearish path
  FxWirePro- Major Crypto levels and bias summary
  FxWirePro- Major Pair levels and bias summary
  FxWirePro: USD/ZAR recovers slightly but trend is still bearish
  Energy Surge Ignites US Inflation: USDCHF Eyes Support Amid Dollar Sell-Off
  FxWirePro: GBP/NZD up trend gains some momentum but hurdles ahead
  FxWirePro- Woodies Pivot(Major)


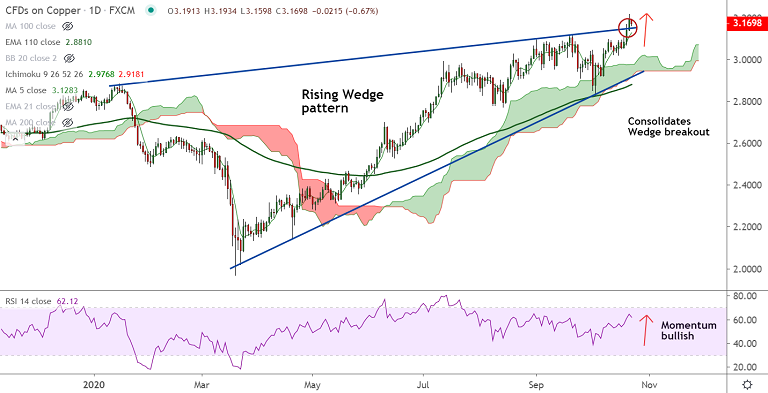
COPPER chart - Trading View
Copper was trading 0.72% lower on the day at 3.168 at around 10:50 GMT, bias still bullish.
Price action is consolidating breakout above 'Rising Wedge' pattern, momentum still with the bulls.
The price of copper has hit fresh multi-month highs (3.216), levels unseen since July 2018 on Wednesday's trade.
Volatility is rising as evidenced by widening Bollinger bands. GMMA indicator shows major and minor trend are strongly bullish.
Price action is above major moving averages and daily cloud offers strong support in case of minor pullbacks.
Momentum indicators are bullish. RSI is above 60 mark and supports uptrend. CCI also supports upside.
Pair finds little resistance on the upside. Scope for test of 3.31 levels. Bullish invalidation only below daily cloud.


