


 FxWirePro: AUD/USD gains some ground but remains sensitive to Middle East tensions
  FxWirePro: EUR/ NZD steadies around 2.0150, retains bid tone
  FxWirePro: EUR/AUD retreats slightly but trend is still bullish
  Ethereum Rises on Geopolitical De-escalation: Pezeshkian’s Peace Signal Ignites Bullish Momentum
  NZDJPY Technical Outlook: Bearish Bias Deepens as Key Resistances Hold
  Yen Resurgence Drives GBPJPY to 2.5-Week Low: Sellers Aim for 208.00
  FxWirePro: USD/ZAR fibo rejection triggers sizeable pullback
  FxWirePro: GBP/AUD runs out of steam but maintains bullish outlook
  FxWirePro: GBP/USD recovers but bears are not done yet again
  FxWirePro: USD/JPY neutral in the near-term, scope for downward resumption
  FxWirePro- Woodies Pivot(Major)
  FxWirePro: EUR/ NZD loses momentum but outlook is bullish
  AUDJPY Pullback Intensifies: Resistance at 110.00 Signals Short Opportunity
  FxWirePro- Major Pair levels and bias summary
  FxWirePro- Major Pair levels and bias summary
  FxWirePro: GBP/USD gains some upside momentum but still bearish


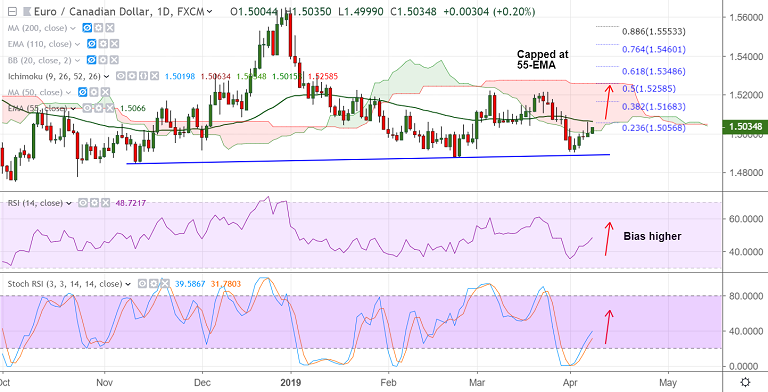
EUR/CAD chart - Trading View
Chart pattern: Falling Triangle pattern
EUR/CAD Technical Analysis: Bias Bullish
- Price has retraced into daily cloud
- Pair has bounced off from near trendline support at 1.4890
- Stochs have rolled over from oversold levels
- RSI is biased higher, 5-DMA has turned
Support levels - 1.4992 (5-DMA), 1.4951 (Nov 23, 2018 low), 1.49
Resistance levels - 1.5066 (55-EMA), 1.5130 (Apr 8 high), 1.5168 (38.2% Fib)
Recommendation: Stay long on break above 55-EMA, SL: 1.50, TP: 1.51/ 1.5130/ 1.5165
For details on FxWirePro's Currency Strength Index, visit http://www.fxwirepro.com/currencyindex.

- News

- Economy

- Central Banks
- Investing
- Research
- Roundups
- Digital Currency
- Insights
- Technical Analysis
- Technology
- Business
- Law
- Health
- Nature
- Fintech
- Science
- Topic
- Opinions
- ©Econometrics LLC . All Rights Reserved.
FxWirePro: EUR/CAD Trade Idea
Monday, April 8, 2019 12:15 PM UTC
Editor's Picks


- Market Data
Most Popular


