


 Energy Surge Ignites US Inflation: USDCHF Eyes Support Amid Dollar Sell-Off
  FxWirePro: USD/ZAR recovers slightly but trend is still bearish
  FxWirePro- Woodies Pivot(Major)
  FxWirePro- Major Pair levels and bias summary
  Ethereum Consolidates: Bullish Technicals Point to a Potential $3,000 Breakout
  Bitcoin’s Volatile Reset: ETFs Rebound as Bulls Eye USD 80,000 Milestone
  FxWirePro: GBP/USD bulls remain cautiously optimistic
  FxWirePro: GBP/AUD gains some upside momentum but still bearish
  FxWirePro: USD/CNY neutral in the near-term, scope for downward resumption
  Euro Holds the Line: EURUSD Finds Support at the 365-EMA as Peace Talks Loom
  FxWirePro: GBP/NZD down trend loses steam, remains on bearish path
  FxWirePro: USD/JPY holding bid into weekend
  FxWirePro: USD/CAD extends decline on broad dollar weakness
  FxWirePro: GBP/NZD up trend gains some momentum but hurdles ahead
  FxWirePro:NZD/USD uptrend loses momentum but bullish setup remains
  FxWirePro: GBP/AUD positions for another drop, eyes 1.8900level


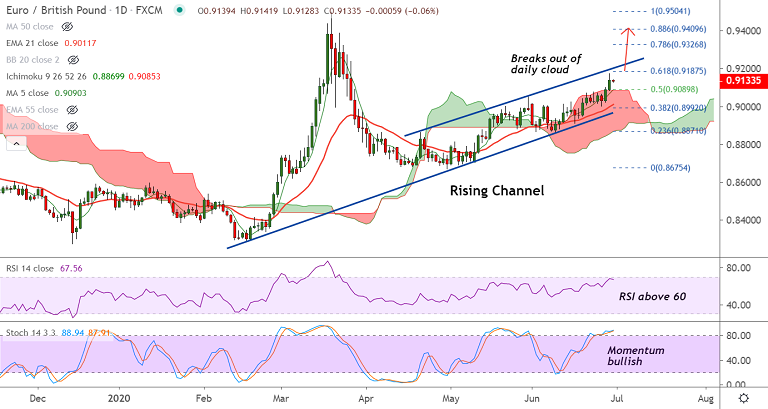
EUR/GBP chart - Trading View
Technical Analysis: Bias Bullish
GMMA Indicator
- Both major and minor trend are strongly bullish
- Scope for further upside
Ichimoku Analysis
- Price action has broken above daily cloud
- The pair holds support at Tenkan Sen
Oscillators
- Stochs and RSI are sharply higher
- Momentum strongly bullish
Bollinger Bands
- Bollinger bands are widening on the daily charts
- Volatility is high raising scope for large price swings
Summary: As the price rises in a 'Rising Channel' pattern, cloud breakout confirms further gains. Rising volatility and bullish momentum to carry prices higher. Major hurdles align at channel top at 0.92 ahead of 78.6% Fib at 0.9326.


