


 FxWirePro- Major European Indices
  FxWirePro- Major Pair levels and bias summary
  NZDJPY Bulls Charge Toward 95.00: Safe-Haven Exodus Drives Kiwi Rally
  FxWirePro- Woodies Pivot(Major)
  Ethereum Consolidates: Bullish Technicals Point to a Potential $3,000 Breakout
  FxWirePro- Major Pair levels and bias summary
  Energy Surge Ignites US Inflation: USDCHF Eyes Support Amid Dollar Sell-Off
  FxWirePro: GBP/NZD down trend loses steam, remains on bearish path
  FxWirePro: EUR/AUD downtrend loses steam but outlook still bearish
  FxWirePro:NZD/USD uptrend loses momentum but bullish setup remains
  FxWirePro: USD/ZAR edges lower ,investors remain on edge
  FxWirePro: USD/CNY neutral in the near-term, scope for downward resumption
  FxWirePro: GBP/USD biased higher but rally currently stretched
  FxWirePro: GBP/NZD up trend gains some momentum but hurdles ahead
  FxWirePro- Major Crypto levels and bias summary


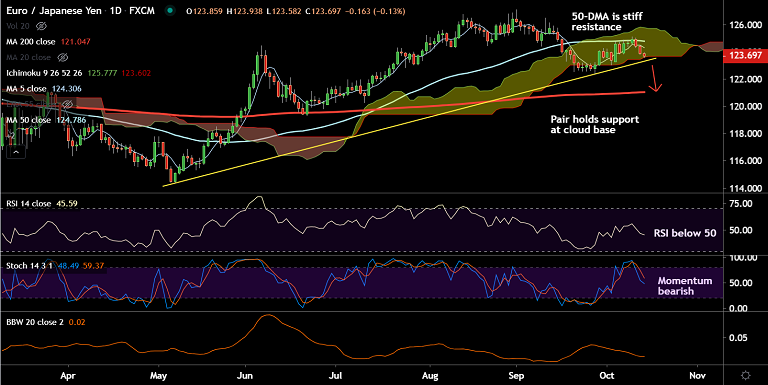
EUR/JPY chart - Trading View
EUR/JPY was trading 0.16% lower on the day at 123.66 at around 09:50 GMT, after closing 0.44% lower in the previous session.
The pair is extending weakness for the 3rd straight session with technical indicators suggesting further downside.
Momentum studies are bearish. Stochs and RSI are biased lower and RSI is below 50 which supports downside.
Recovery attempts were rejected at 50-DMA and price action is currently pivotal at cloud base support.
Break below cloud will drag prices lower. Scope for test of 200-DMA at 121.04.
On the flipside, 50-DMA is stiff resistance at 124.78. Decisive break above will negate further bearishness.
Support levels - 123.30 (trendline support), 121.04 (200-DMA)
Resistance levels - 124.30 (5-DMA), 124.78 (50-DMA)


