


 FxWirePro- Woodies Pivot(Major)
  FxWirePro:NZD/USD continues to recovers , upside pressure builds
  Pound on Pause: GBPJPY Bulls Regroup for a Potential Sprint Toward 215.00
  Bitcoin’s Volatile Reset: ETFs Rebound as Bulls Eye USD 80,000 Milestone
  FxWirePro:NZD/USD uptrend loses momentum but bullish setup remains
  FxWirePro: USD/JPY steadies around 158.75, bias bullish
  FxWirePro: EUR/AUD under pressure as key support gives way
  FxWirePro: GBP/USD bulls remain cautiously optimistic
  Aussie Consolidates After Peak: AUDJPY Bulls Eye a Strategic Entry for the 115.00 Target
  FxWirePro: USD/ZAR edges lower ,investors remain on edge
  FxWirePro: GBP/AUD positions for another drop, eyes 1.8900level
  FxWirePro: GBP/NZD down trend loses steam, remains on bearish path
  FxWirePro: AUD/USD retreats slightly but trend is still bullish
  FxWirePro- Major European Indices
  Bitcoin’s Islamabad Watch: BTCUSD Consolidates Near 71,421 USD as Geopolitical Peace Talks Loom
  Euro Holds the Line: EURUSD Finds Support at the 365-EMA as Peace Talks Loom


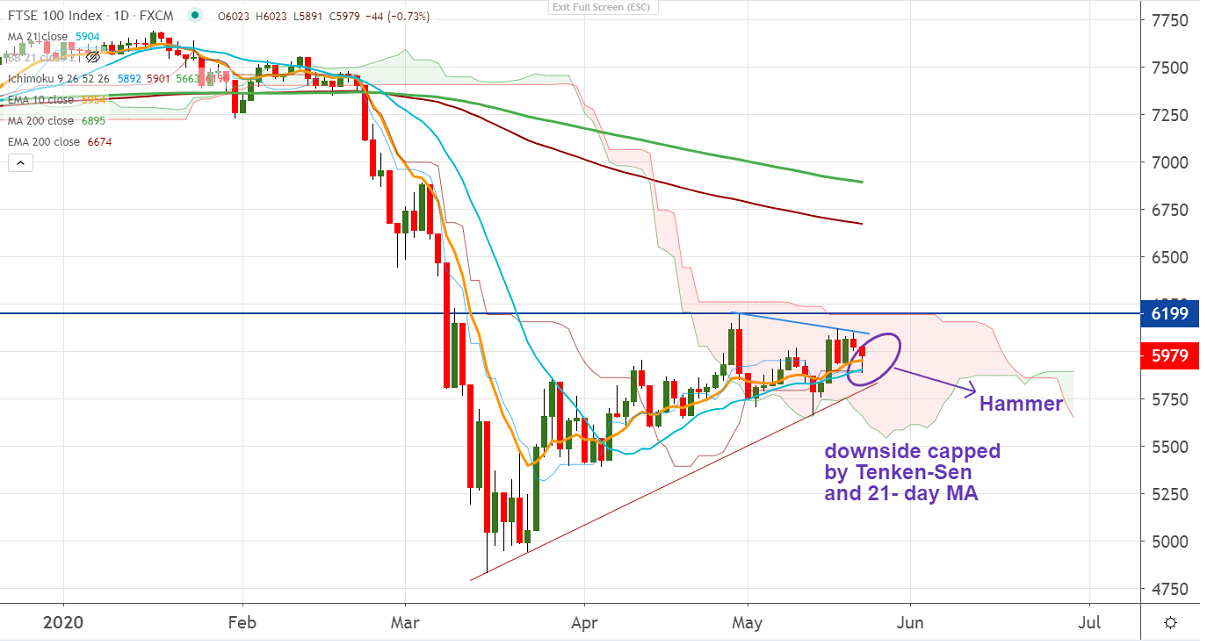
Ichimoku Analysis (Daily chart)
Tenken-Sen- 5892
Kijun-Sen- 5899
FTSE100 upward got exhausted yesterday and lost more than 200 pips from high of 6098. The global stock market sell-off due to weak US economic data is putting pressure on FTSE100. It hits a low of 5891 (Kijun-Sen) at the time of writing and recovered sharply till 5977. The candlestick pattern looks like a hammer in the daily chart.
The near-term resistance to be watched is 6000, and any violation above will take the index till 6034/6098 (yesterday's high)/6123. Significant trend continuation only if it crosses 6200.
The immediate support is around 5938, indicative violation below targets 5889. Bearish continuation only if it breaks below 5800.
It is good to buy on dips around 5945-50 with SL around 5889 for the TP of 6120.


