


 FxWirePro: GBP/AUD maintains bearish bias with focus on 1.8800
  FxWirePro- Woodies pivot (Major)
  FxWirePro-Major European Indices
  FxWirePro- Major Crypto levels and bias summary
  Euro Stabilizes Near 1.1713 as IFO Weakness Meets Oil Volatility; 1.1800 in Focus
  FxWirePro: USD/ZAR gains upside momentum as bulls take charge
  FxWirePro: USD/ZAR slips as rand gains on peace talk hopes
  FxWirePro- Major Pair levels and bias summary
  FxWirePro: EUR/AUD edges higher but bearish outlook persists
  FxWirePro- Major Pair levels and bias summary
  FxWirePro: EUR/ NZD under pressure after early buying dries up
  FxWirePro- Woodies pivot (Major)
  FxWirePro: GBP/NZD continues to recovers , upside pressure builds
  FxWirePro: AUD/USD nurses losses in subdued trading
  NZDJPY Dip-Buy Setup: 93.58 Holds as Bulls Eye 95–96


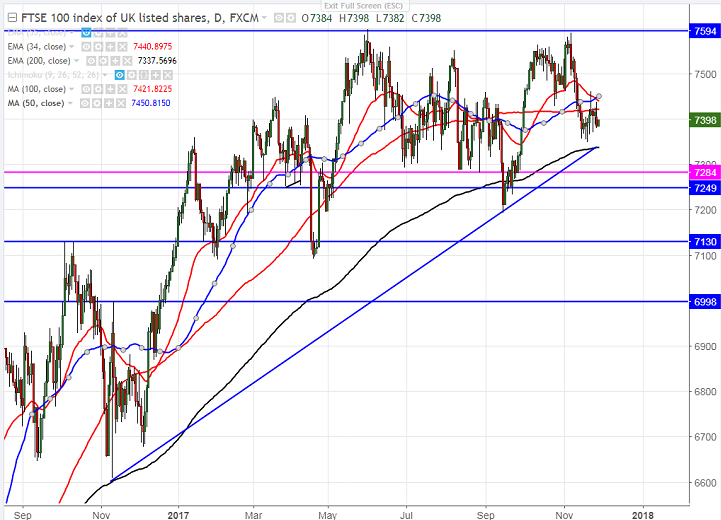
- Chart pattern – Double top
- FTSE100 has formed a temporary top near 7600 and started to decline sharply from that level. The index dipped till 7348 and is currently trading around 7384.
- The index’s short term support is around 7347-7336 (61.8% retracement of 7193 and 7590 and 200- day EMA) and any break below will drag the index down till 7282/7193. Any convincing break below 7190 confirms long term trend reversal, a decline till 7000 is likely.
- The near term resistance is around 7498 (61.8% retracement of 7590 and 7348) and any break above will take the index till 7550/7600.
- Overall bullish continuation only above 7600.
It is good to sell on rallies around 7425-7435 with SL around 7500 for the TP of 7335/7195.


