


 FxWirePro: GBP/NZD remains buoyant, looks to extend gains
  FxWirePro: AUD/USD downside pressure builds, key support level in focus
  FxWirePro: USD/CAD runs out of steam but maintains bullish outlook
  FxWirePro- Major Crypto levels and bias summary
  FxWirePro- Woodies Pivot(Major)
  FxWirePro- Major European Indices
  Bitcoin Battles Volatility: Institutional Support Eyes USD 64,000 Floor Amid Geopolitical Tensions
  EUR/JPY Bulls Charge: Eyeing 186.00 as Euro Strength Intensifies
  FxWirePro: USD/ZAR sustains gains as uptrend remains strong
  NZDJPY Bears Take Control: New Zealand Dollar Retreats as 92 Resistance Holds Firm
  FxWirePro: GBP/USD recovers but bears are not done yet again
  FxWirePro- Major Pair levels and bias summary
  Euro Retreats as Geopolitical Tensions Surge: EURUSD Eyes 1.1400 Floor Amid Safe-Haven Demand
  FxWirePro: USD/ZAR fibo rejection triggers sizeable pullback
  FxWirePro: GBP/NZD range to extend until there is game changing news
  FxWirePro: EUR/ NZD steadies around 2.0150, retains bid tone
  FxWirePro:NZD/USD drifts lower, could be on verge of bigger drop


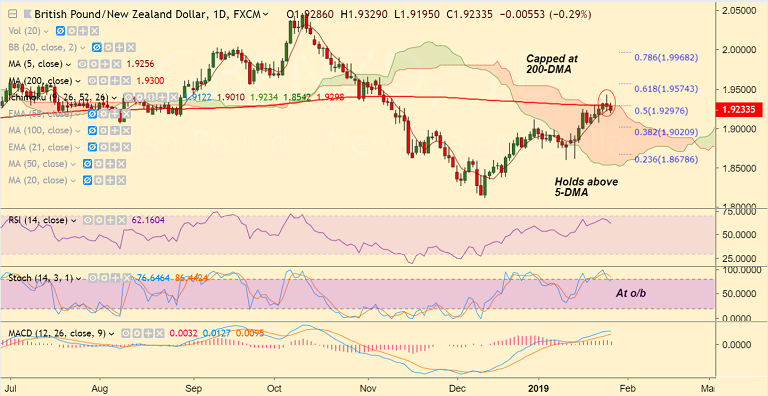
GBP/NZD chart on Trading View used for analysis
- GBP/NZD trades 0.28% lower on the day at 1.9234 at 1226 GMT.
- Recovery in the pair has failed at 200-DMA, bearish invalidation only on breakout above.
- We evidence a spinning top formation at highs, raising scope for weakness.
- Price action has dipped below 5-DMA and further weakness eyes 110-EMA at 1.9117.
- Break below 110-EMA will see weakness till 38.2% Fib at 1.9020.
- On the flipside, decisive breakout above 200-DMA will see gains till 61.8% Fib at 1.9574.
Support levels - 1.9075 (Jan 23 high), 1.9020 (38.2% Fib)
Resistance levels - 1.93 (200-DMA), 1.9574 (61.8% Fib)
For details on FxWirePro's Currency Strength Index, visit http://www.fxwirepro.com/currencyindex.


