


 FxWirePro: EUR/AUD retreats slightly but trend is still bullish
  FxWirePro: EUR/ NZD loses momentum but outlook is bullish
  Yen Resurgence Drives GBPJPY to 2.5-Week Low: Sellers Aim for 208.00
  FxWirePro: NZD/USD cautiously bid as traders sense end to Iran war
  FxWirePro: AUD/USD gains some ground but remains sensitive to Middle East tensions
  FxWirePro: GBP/USD recovers but bears are not done yet again
  FxWirePro: GBP/USD gains some upside momentum but still bearish
  FxWirePro: USD/ZAR fibo rejection triggers sizeable pullback
  FxWirePro: EUR/AUD gaining momentum for a move towards 1.6800 level
  Ethereum Rises on Geopolitical De-escalation: Pezeshkian’s Peace Signal Ignites Bullish Momentum
  FxWirePro: GBP/NZD range to extend until there is game changing news
  FxWirePro- Woodies Pivot(Major)
  FxWirePro- Major Crypto levels and bias summary
  NZDJPY Technical Outlook: Bearish Bias Deepens as Key Resistances Hold
  FxWirePro: USD/CAD runs out of steam but maintains bullish outlook


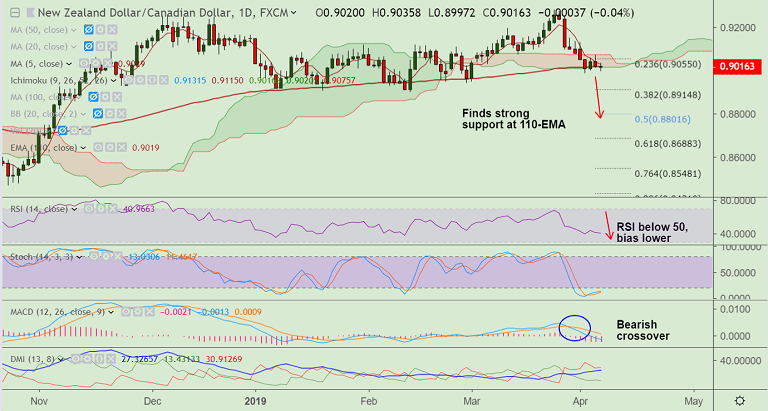
NZD/CAD chart - Trading View
- NZD/CAD extends sideways along 110-EMA support, bias bearish.
- Focus now on Canadian employment data for further impetus.
- Technical studies support downside in the pair. Break below 110-EMA will see further weakness.
- RSI is below 50 and biased lower. MACD supports weakness and -ve DMI is dominant adding to the bearish bias.
- Break below 110-EMA eyes 38.2% Fib at 0.8914 ahead of 200-DMA at 0.8883.
- 55-EMA caps recovery attempts. Break above could see gains till 200-DMA.
Support levels - 0.8948 (Feb 22 low), 0.8914 (38.2% Fib), 0.89
Resistance levels - 0.9030 (5-DMA), 0.9055 (23.6% Fib), 0.9075 (cloud top)
For details on FxWirePro's Currency Strength Index, visit http://www.fxwirepro.com/currencyindex.


