


 FxWirePro- Major Crypto levels and bias summary
  FxWirePro: USD/ZAR fibo rejection triggers sizeable pullback
  FxWirePro- Woodies Pivot(Major)
  FxWirePro: GBP/USD gains some upside momentum but still bearish
  FxWirePro: USD/ZAR loses momentum but outlook is bullish
  EUR/JPY Bulls Charge: Eyeing 186.00 as Euro Strength Intensifies
  FxWirePro: AUD/USD gains some ground but remains sensitive to Middle East tensions
  FxWirePro- Major Pair levels and bias summary
  Ethereum Rises on Geopolitical De-escalation: Pezeshkian’s Peace Signal Ignites Bullish Momentum
  FxWirePro- Woodies Pivot(Major)
  Bitcoin Recovers Amid Easing Geopolitics: Bulls Target USD 80,000 Support Rebound
  Euro Bulls Charge Past 1.1600: Broad Dollar Sell-Off Ignites Powerful EURUSD Rally
  FxWirePro: NZD/USD cautiously bid as traders sense end to Iran war
  FxWirePro: GBP/USD recovers but bears are not done yet again
  AUDJPY Pullback Intensifies: Resistance at 110.00 Signals Short Opportunity
  AUDJPY Pullback Intensifies: Resistance at 110.00 Signals Short Opportunity
  FxWirePro: EUR/ NZD loses momentum but outlook is bullish


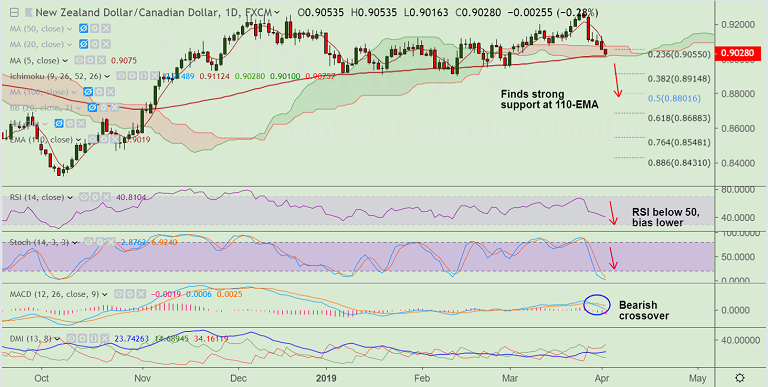
NZD/CAD chart - Trading View
- NZD/CAD is extending weakness for the 6th straight session, bias bearish.
- The pair has slipped below 55-EMA and is trading 0.29% lower on the day at 0.9027 at 0645 GMT.
- Strong support is seen at 0.9019 to 0.9010 zone (110-EMA and daily cloud), break below will see major downside.
- Technical indicators support weakness. RSI is below 50, bias lower. MACD shows bearish crossover on signal line.
- Break below 110-EMA and cloud will see drag till 38.2% Fib at 0.8914 ahead of 200-DMA at 0.8885.
- Rejection at 110-EMA and retrace above 200W SMA could see further upside.
Support levels - 0.9019 (110-EMA), 0.9010 (cloud base), 0.8914 (38.2% Fib)
Resistance levels - 0.9062 (200W SMA), 0.9075 (5-DMA and cloud top), 0.91
Recommendation: Watch out for break below 110-EMA to go short, SL: 0.9075, TP: 1.8915/ 1.8885
For details on FxWirePro's Currency Strength Index, visit http://www.fxwirepro.com/currencyindex.


