


 NZDJPY Bears Take Control: New Zealand Dollar Retreats as 92 Resistance Holds Firm
  FxWirePro: EUR/ NZD steadies around 2.0150, retains bid tone
  FxWirePro- Major Pair levels and bias summary
  FxWirePro: EUR/AUD gaining momentum for a move towards 1.6800 level
  Ethereum Retreats Toward USD 2,000: Technicals Signal Caution as ETH Mimics Bitcoin’s Pullback
  FxWirePro: USD/CNY gains some ground but bearish outlook persists
  FxWirePro: USD/JPY firms as Trump's address on Gulf war spark fresh concerns
  FxWirePro- Woodies Pivot(Major)
  FxWirePro: GBP/USD outlook weaker on renewed downside pressure
  FxWirePro: EUR/AUD eases slightly but trend is still bullish
  EUR/JPY Bulls Charge: Eyeing 186.00 as Euro Strength Intensifies
  FxWirePro: USD/CAD runs out of steam but maintains bullish outlook
  FxWirePro:NZD/USD drifts lower, could be on verge of bigger drop
  FxWirePro: USD/ZAR fibo rejection triggers sizeable pullback
  FxWirePro- Major European Indices
  FxWirePro: USD/ZAR sustains gains as uptrend remains strong
  Euro Retreats as Geopolitical Tensions Surge: EURUSD Eyes 1.1400 Floor Amid Safe-Haven Demand


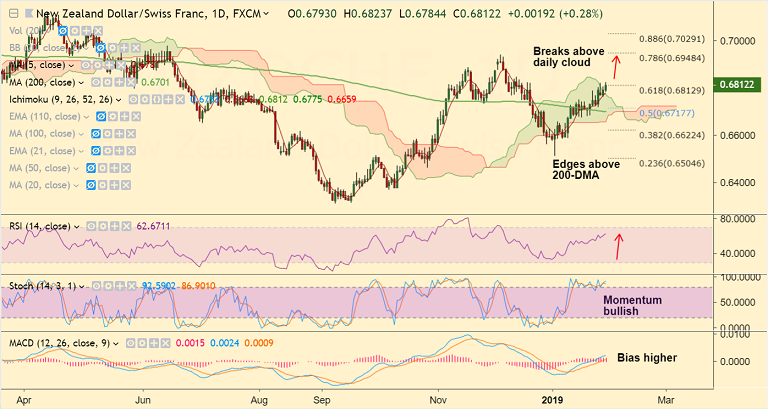
NZD/CHF chart on Trading View used for analysis
- NZD/CHF shows breakout at daily cloud, bullish momentum could see further gains.
- The pair is extending gains after breakout above 200-DMA, bias bullish.
- Technical indicators on daily charts suggest further upside for the pair.
- Stochs and RSI are biased higher and price action is above major moving averages.
- The pair is currently hovering around 61.8% Fib and next major resistance is seen at 0.6925 (trendline).
- On the flipside, immediate support is seen at 5-DMA at 0.6781. Break below 200-DMA negates bullish bias.
Support levels - 0.6781 (5-DMA), 0.6717 (50% Fib), 0.6701 (200-DMA)
Resistance levels - 0.6888 (Nov 16 high), 0.6925 (trendline), 0.6948 (78.6% Fib)
For details on FxWirePro's Currency Strength Index, visit http://www.fxwirepro.com/currencyindex.


